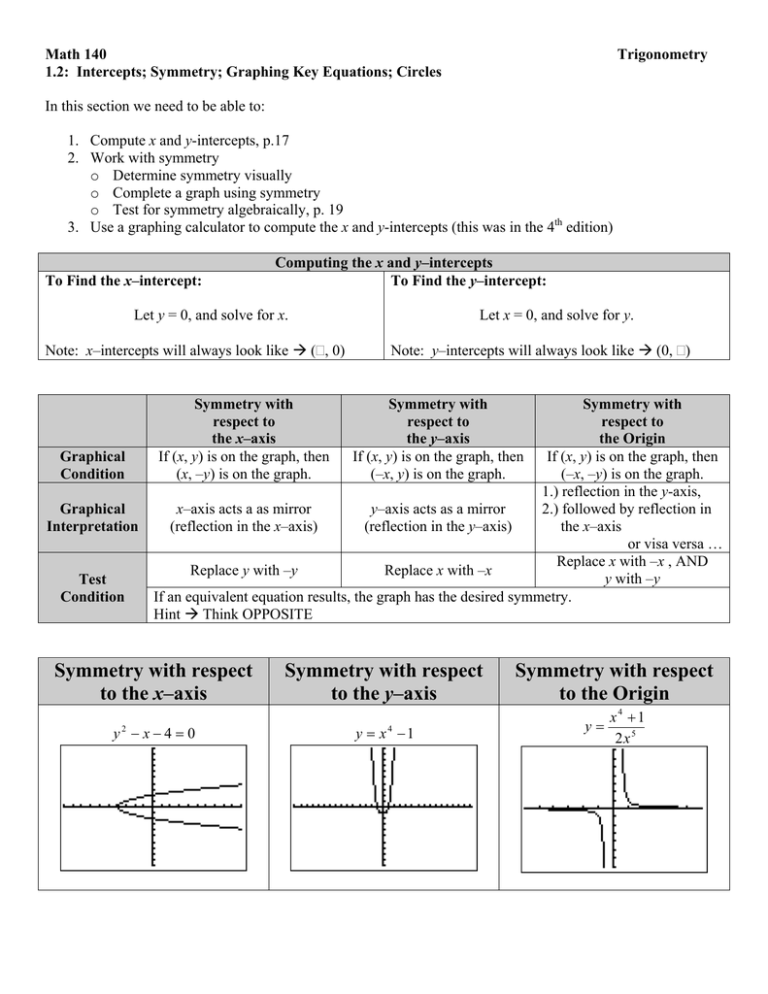
Symmetry with respect to the x–axis Symmetry with respect to the y
advertisement

Math 140 1.2: Intercepts; Symmetry; Graphing Key Equations; Circles Trigonometry In this section we need to be able to: 1. Compute x and y-intercepts, p.17 2. Work with symmetry o Determine symmetry visually o Complete a graph using symmetry o Test for symmetry algebraically, p. 19 3. Use a graphing calculator to compute the x and y-intercepts (this was in the 4th edition) To Find the x–intercept: Computing the x and y–intercepts To Find the y–intercept: Let y = 0, and solve for x. Note: x–intercepts will always look like ( , 0) Symmetry with respect to the x–axis If (x, y) is on the graph, then (x, –y) is on the graph. Let x = 0, and solve for y. Note: y–intercepts will always look like (0, ) Symmetry with respect to the y–axis If (x, y) is on the graph, then (–x, y) is on the graph. Symmetry with respect to the Origin If (x, y) is on the graph, then Graphical (–x, –y) is on the graph. Condition 1.) reflection in the y-axis, x–axis acts a as mirror y–axis acts as a mirror 2.) followed by reflection in Graphical (reflection in the x–axis) (reflection in the y–axis) the x–axis Interpretation or visa versa … Replace x with –x , AND Replace y with –y Replace x with –x y with –y Test Condition If an equivalent equation results, the graph has the desired symmetry. Hint Think OPPOSITE Symmetry with respect to the x–axis Symmetry with respect to the y–axis y x40 y x 1 2 4 Symmetry with respect to the Origin y x4 1 2x5 Example 1: Complete the graph so that it has the type of symmetry indicated. x–axis y–axis Origin Example 2: (62) List the intercepts and test for symmetry. You should be able to verify the symmetry visually on your graphing calculator; then compute the intercepts with the correct key punch sequence y x2 4 2x Directions for computing the intercepts on the TI Graphing Calculator are on your graphing calculator handouts. Why do we need to know about symmetry? Knowledge about symmetry makes graphing easier since we only need to do half of the work. For example, suppose that we know a graph is symmetric with respect to the y–axis. Then the y–axis acts as a mirror reflecting quadrants I and IV (the right plane) onto quadrants II and III (the left plane), or visa versa. So when we set up our tables of values, we only need to consider x > 0, because when x < 0 the y–values produced are the same. Why do we need to know how to calculate the x and y–intercepts by hand? Often times we are given an equation (and no other information) and asked to draw a graph of the equation. Even if we are using a graphing calculator this can still be a time consuming task because we need to get the full graph (all the important details) in the viewing rectangle of the graphing calculator. The standard viewing rectangle that we use is –10 to +10 along the x and y–axes. Often times this “WINDOW” will show the full graph, but sometimes it will not. When this happens knowledge about the x and y–intercepts will allow us to adjust the WINDOW the correctly position all the important details of the graph in the viewing rectangle.

