CRIMES AGAINST PERSONS
WITH DISABILITIES
Persons with disabilities are victimized by crime at much
VIOLENT CRIME AGAINST PERSONS
WITH AND WITHOUT DISABILITIES
higher rates than the rest of the population, and they are
often targeted specifically because of their disabilities. As
compared to other population groups, victims with disabilities experience higher rates of victimization by persons
known to them, and they report crime less frequently, often
because of the nature of their disabilities, such as cognitive or physical disabilities or mental illness. In addition to
violent victimization and property offenses, crimes against
persons with disabilities can also constitute a subset of
hate crimes. As described more fully in the subsection
devoted to hate crimes, these crimes are defined by being motivated by the offender’s bias against victims of a
particular group, such as those with disabilities. A majority
of the information in this section relies on findings from
the National Crime Victimization Survey (NCVS), which
only includes those 12 and older with disabilities living
among the general population in household settings. As
a result, this may contribute to an underestimation of the
level of violence experienced by people with disabilities as
it does not take into account people living in institutions,
people who are homeless or children under 12. The section
concludes with several data points, compiled from a variety
of other sources, about violence against children with disabilities as they are at a substantially greater risk than their
non-disabled peers of being victimized.1
violent crime rate per 1,000
70
60.4
60
50
50.1
42.9
47.2
40
30
20
10
s
son h
per wit ies
ilit
ab
dis
+
2009
2010
2011
2012
22.4
19.5 19.4
22.3
s
son t
per ithouies
w ilit
ab
dis
• In 2012, for both males and females, the ageadjusted rate of violent crime was greater for those
with disabilities than the rate for those without
disabilities. The rate for males with disabilities
was 59.0 per 1,000, compared to 25.1 per 1,000
for males without disabilities; for females with
disabilities, the rate was 61.8 per 1,000, compared to
19.5 per 1,000 for females without disabilities.4
• The rate of aggravated assault reported against
persons with disabilities in 2009 was 6.6 per 1,000.
That number increased to 10 in 2012. From 2011 to
2012, the aggravated assault rate decreased slightly
from 10.5 to 10.0.5
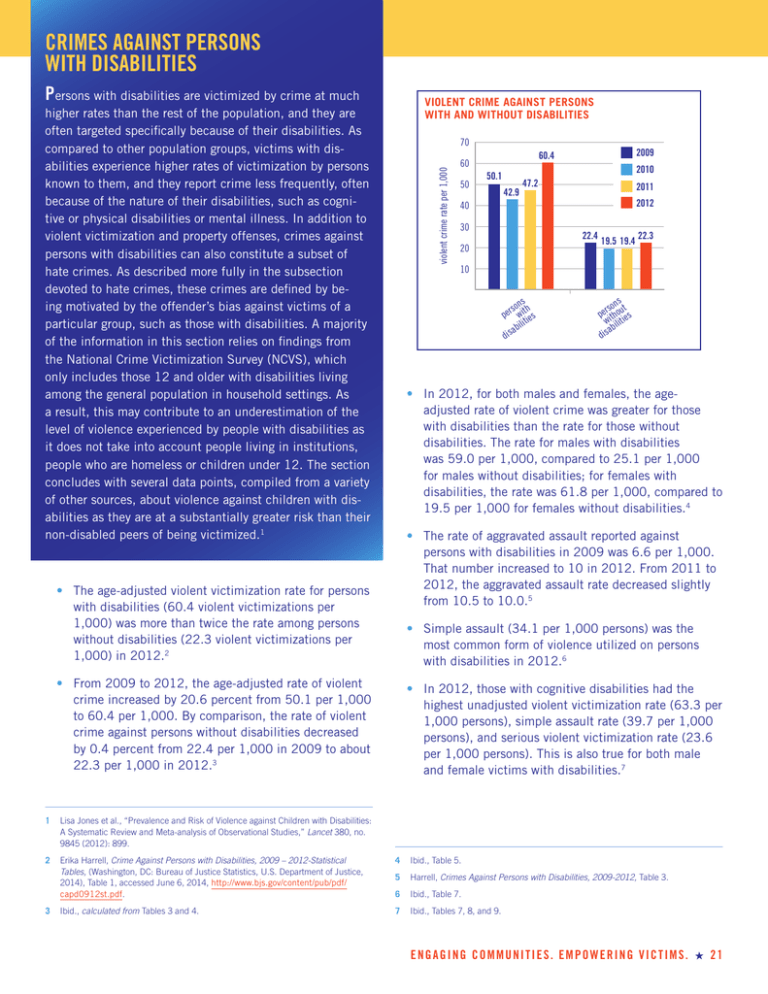
• The age-adjusted violent victimization rate for persons
with disabilities (60.4 violent victimizations per
1,000) was more than twice the rate among persons
without disabilities (22.3 violent victimizations per
1,000) in 2012.2
• Simple assault (34.1 per 1,000 persons) was the
most common form of violence utilized on persons
with disabilities in 2012.6
• From 2009 to 2012, the age-adjusted rate of violent
crime increased by 20.6 percent from 50.1 per 1,000
to 60.4 per 1,000. By comparison, the rate of violent
crime against persons without disabilities decreased
by 0.4 percent from 22.4 per 1,000 in 2009 to about
22.3 per 1,000 in 2012.3
• In 2012, those with cognitive disabilities had the
highest unadjusted violent victimization rate (63.3 per
1,000 persons), simple assault rate (39.7 per 1,000
persons), and serious violent victimization rate (23.6
per 1,000 persons). This is also true for both male
and female victims with disabilities.7
1
Lisa Jones et al., “Prevalence and Risk of Violence against Children with Disabilities:
A Systematic Review and Meta-analysis of Observational Studies,” Lancet 380, no.
9845 (2012): 899.
2
Erika Harrell, Crime Against Persons with Disabilities, 2009 – 2012-Statistical
Tables, (Washington, DC: Bureau of Justice Statistics, U.S. Department of Justice,
2014), Table 1, accessed June 6, 2014, http://www.bjs.gov/content/pub/pdf/
capd0912st.pdf.
4
Ibid., Table 5.
5
Harrell, Crimes Against Persons with Disabilities, 2009-2012, Table 3.
6
Ibid., Table 7.
Ibid., calculated from Tables 3 and 4.
7
Ibid., Tables 7, 8, and 9.
3
E N G A G I N G C O M M U N I T I E S . E M P O W E R I N G V I C T I M S . 2 1 Crimes Against Persons with Disabilities
• Intimate partner violence accounted for 13 percent
of violence against persons with disabilities in 2010,
similar to the percentage of violence against persons
without disabilities, which is 14 percent.9
• Offenders were strangers to the victim in 33
percent of violent victimizations against persons
with disabilities in 2010, compared to 41 percent
of violent victimizations against persons without
disabilities.10
• Among persons with disabilities, the percentage of
violence in which the victim faced an armed offender
increased from 20 percent in 2008 to 30 percent
in 2010.11 The offender was armed with a firearm
in about 14 percent of victimizations involving
persons with disabilities, compared to 8 percent of
victimizations against those without disabilities in
2010.12
• About 41 percent of the violent victimizations against
persons with disabilities were reported to police in
2010, compared to about 53 percent of victimizations
against persons without disabilities.13
• A total of 92 anti-disability hate crimes were reported
to the police in 2012. Of these, 18 were motivated by
bias against persons with physical disabilities and 74
by bias against those with mental disabilities.16
• In 2012, 52.1 percent of violent crimes against
people with a disability were against those with
multiple disabilities, down from 56.9 percent in 2010
and up from 41.4 percent in 2009.17
• Anti-disability-biased incidents involving 102 total
victims were reported to police in 2012. Of the 102
victims, 61 experienced crimes against persons,
35 experienced crimes against property, and 6
experienced a crime against society.18
ANTI-DISABILITY OFFENSES BY DISABILITY TYPE, 2012
50
8
Ibid., Table 1.
9
Ibid.
10 Harrell, Crimes Against Persons with Disabilities, 2008-2010, (Washington, DC:
Bureau of Justice Statistics, U.S. Department of Justice, 2011), Table 4, accessed
October 6, 2014, http://www.bjs.gov/content/pub/pdf/capd10st.pdf.
11 Harrell, Crime Against Persons with Disabilities, 2008-2010, Table 5.
12 Ibid.
13 Ibid., 5.
14 Ibid., 11.
15 Michael R. Rand and Erika Harrell, Crime Against People with Disabilities, 2007,
(Washington, DC: Bureau of Justice Statistics, U.S. Department of Justice, 2009), 4,
accessed October 6, 2014, http://bjs.ojp.usdoj.gov/content/pub/pdf/capd07.pdf.
22 2015 NCVRW RESOURCE GUIDE
28
32
30
20
16
10
5
3
st
ain s
ag erson
s
me p
• Persons with disabilities reported to the police 39
percent of robberies and 40 percent of aggravated
assaults in 2010. Persons without disabilities reported
much higher percentages of these crimes: 63 percent
of robberies and 65 percent of aggravated assaults.14
• Crimes against disabled persons can constitute a form
of hate crime. In 2007, about 19 percent of violent
crime victims with a disability said they believed they
had been victimized because of their disability.15
anti-physical disability
biased offenses
anti-mental disability
biased28offenses
45
40
number of incidents
• Between 2009 and 2012, reported instances of
rape/sexual assault against persons with a disability
increased from 1.7 in 2009 to 3.6 in 2012.8
cri
cri
m
st
ain y
ag opert
s
r
e p
1
st
ain y
ag ociet
s
s
me
cri
• Of the 20 reported offenses against those with
physical disabilities in 2012, 4 were aggravated
assault, 9 simple assault, 3 intimidation, 1 larceny/
theft, 1 motor vehicle theft, 1 classified as “other”
crimes against property, and 1 classified as crimes
against society.19
16 Federal Bureau of Investigation, Hate Crime Statistics, 2012, (Washington,
DC: U.S. Department of Justice, 2012), Table 1, accessed June 6, 2014,
http://www.fbi.gov/about-us/cjis/ucr/hate-crime/2012/tables-and-datadeclarations/1tabledatadecpdf/table_1_incidents_offenses_victims_and_known_
offenders_by_bias_motivation_2012.xls.
17 Harrell, Crime Against Persons with Disabilities, 2009-2013, Table 6.
18 Federal Bureau of Investigation, 2012 Hate Crime Statistics, Table 7, accessed
June 6, 2014, http://www.fbi.gov/about-us/cjis/ucr/hate-crime/2012/tablesand-data-declarations/7tabledatadecpdf/table_7_victims_offense_type_by_
bias_motivation_2012.xls. Crimes against society include drug-related offenses,
prostitution, and animal cruelty.
19 Ibid., Table 7.
Crimes Against Persons with Disabilities
• Of the 82 offenses against those with mental
disabilities, 15 were aggravated assault, 24 simple
assault, 5 intimidation, 1 classified as “other” crimes
against persons, 1 robbery, 3 burglary, 12 larceny/
theft, 11 destruction of property/vandalism, 5
classified as “other” crimes against property, and 5
crimes against society.20
• In 2012, 3.2 percent of child victims of abuse and
neglect had reported a behavioral problem disability,
2.5 percent had an emotional disturbance disability,
1.1 percent reported a learning disability, 1.0 percent
a visual or hearing impairment, 0.7 percent a physical
disability, 0.5 percent an intellectual disability, and
4.3 percent other medical disability.25
• Between 2004 and 2012, victims identified disability
as the perceived offender motivation in hate crimes
11 percent of the time, down from 22 percent in
2011, and the same as 2004 (11 percent).21
• In a review of the literature, it was estimated
approximately 1 in 4 or 26.7 percent of disabled
children will be a victim of violence. Of those, 20.4
percent will be victims of physical violence and 13.7
percent victims of sexual violence.26
• In a national survey of over 1,300 people with
disabilities and their family members in 2012, over
70 percent reported being victims of abuse. Types
of abuse included verbal-emotional (87.2 percent),
physical (50.6 percent), sexual (41.6 percent),
neglect (37.3 percent), and financial (31.5 percent).22
• In the same survey, 62.7 percent who reported
being victims of abuse did not report the abuse to
authorities. When looking at families of victims and
victims, 43.3 percent of incidents were not reported
to authorities.23
• In the same study, it was observed that children
with psychological or intellectual disabilities are
significantly more likely to be victims of sexual
assault, compared to children with physical
disabilities.27
• In a study of 4,155 students in special education,
children with attention deficient hyperactive disorder
(ADHD) experienced the greatest risk of victimization
compared to children with other disabilities. Children
with emotional disturbance were the second group
of disabled children most likely to experience bully
victimization.28
Crimes Against Children with Disabilities
• In 2012, 13.3 percent of child victims of abuse
or neglect had a reported disability based on data
collected by the Department of Health and Human
Services.24
20 Ibid.
21 Meagan Meuchel, Hate Crime Victimization, 2004-2012--Statistical Tables,
(Washington, DC: Bureau of Justice Statistics, U.S. Department of Justice, 2014),
Table 2, accessed June 8, 2014, http://www.bjs.gov/content/pub/pdf/hcv0412st.
pdf.
22 Nora J. Baladerian, Thomas F. Colemand, and Jim Stream, Findings from the 2012
Survey on Abuse of People with Disabilities, (Los Angeles, CA: Spectrum Institute,
Disability and Abuse Project, 2013), accessed October 6, 2014, http://www.
disabilityandabuse.org/survey/findings.pdf.
25 Ibid., Table 3–9.
26 Lisa Jones et al., “Prevalence and Risk of Violence against Children with Disabilities:
A Systematic Review and Meta-analysis of Observational Studies,” Lancet 380, no.
9845 (2012): 899.
23 Ibid.
27 Ibid.
24 Child Maltreatment 2012, (U.S. Department of Health and Human Services,
Administration for Children and Families, Administration on Children, Youth and
Families, Children’s Bureau), Table 3–9, accessed October 6, 2014, http://www.acf.
hhs.gov/programs/cb/resource/child-maltreatment-2012.
28 Jamilia J. Blake et al., “Predictors of Bully Victimization in Student with Disabilities:
A Longitudinal Examination Using a National Data Set,” Journal of Disability Policy
Studies (2014): accessed October 19, 2014, http://dps.sagepub.com/content/
early/2014/05/30/1044207314539012.abstract.
E N G A G I N G C O M M U N I T I E S . E M P O W E R I N G V I C T I M S . 2 3


