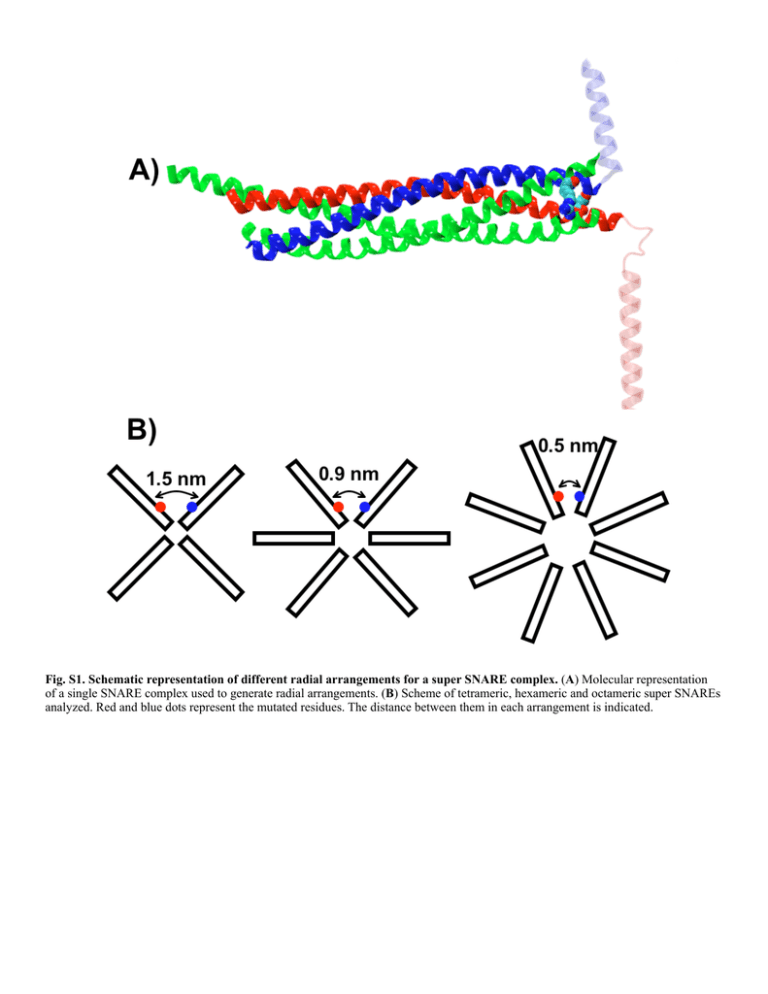
Fig. S1. Schematic representation of different radial arrangements
advertisement

Fig. S1. Schematic representation of different radial arrangements for a super SNARE complex. (A) Molecular representation of a single SNARE complex used to generate radial arrangements. (B) Scheme of tetrameric, hexameric and octameric super SNAREs analyzed. Red and blue dots represent the mutated residues. The distance between them in each arrangement is indicated. Fig. S2. The point mutations R198D of SNAP-25 and D250R of syntaxin do not prevent SNARE complex assembly in vitro. SNARE complex formation was analyzed using recombinant proteins after 10 and 30 minutes incubation at 25°C. Reactions were stopped by addition of SDS-containing sample buffer. Samples were then subjected to SDS-PAGE with or without boiling. Proteins were visualized by Comassie staining. SNARE complexes migrate at different heights (see arrows) due to the different molecular weights of the recombinant SNARE proteins used in the incubation mixture. The apparent MW of the two reference bands at 90 kDa and 210 kDa are marked above the respective gel bands. Fig. S3. Semi-quantitative PCR analysis of wild-type (wt) and mutant SNAP-25-R206D and Syntaxin-D253R isoforms in third instar larvae brains. Representative agarose gel electrophoresis of PCR-amplified fragments produced on cDNA from brain total RNA. (A) analysis of SNAP-25 expression. (B) analysis of syntaxin expression. Lanes 1 show the result of the hybridization with primers specific for wt proteins (panel A for SNAP-25, and panel B for syntaxin) performed in animals expressing endogenous wt proteins plus UAS-driven wt-proteins. Lanes 2 of panels A and B represent the signal deriving from animals expressing the wt SNAP25 or syntaxin proteins probed with the reverse primers designed to recognize the mutant proteins. As there is no mutant RNA in these animals, the lack of signal is an indication of the fidelity of the reverse primers used to detect the mutated proteins which does not recognize at all the wt protein. Lanes 3 and 6 of both panels are loading controls made with the rp49 house keeping gene and shows that indeed the same amount of amplification was achieved. Lanes 4 show the expression of the wt protein (SNAP-25 and syntaxin in panels A and B respectively) in animals in presence of the UAS-driven expression of the mutant proteins. Lanes 5 show the expression of the mutant proteins probed with reverse primers specific for the mutant proteins. Fig. S4. Representative traces of spontaneous neurotransmitter release. Miniature end-plate potentials in transgenic animals expressing the wild type form of SNAP25 (black line) or mutated form of SNAP-25 (dark grey line) or Syntaxin (grey line). Calibration bar on the right. Fig. S5. Representative traces of evoked neurotransmitter release. Evoked end-plate potentials in transgenic animals expressing the wild type form of SNAP25 (black line) or mutated form of SNAP-25 (dark grey line) or Syntaxin (grey line). Arrow indicates the “stimulus artifact”, corresponding to the moment of nerve stimulation. Calibration bar on the left.

