Graphing in DataStudio
advertisement
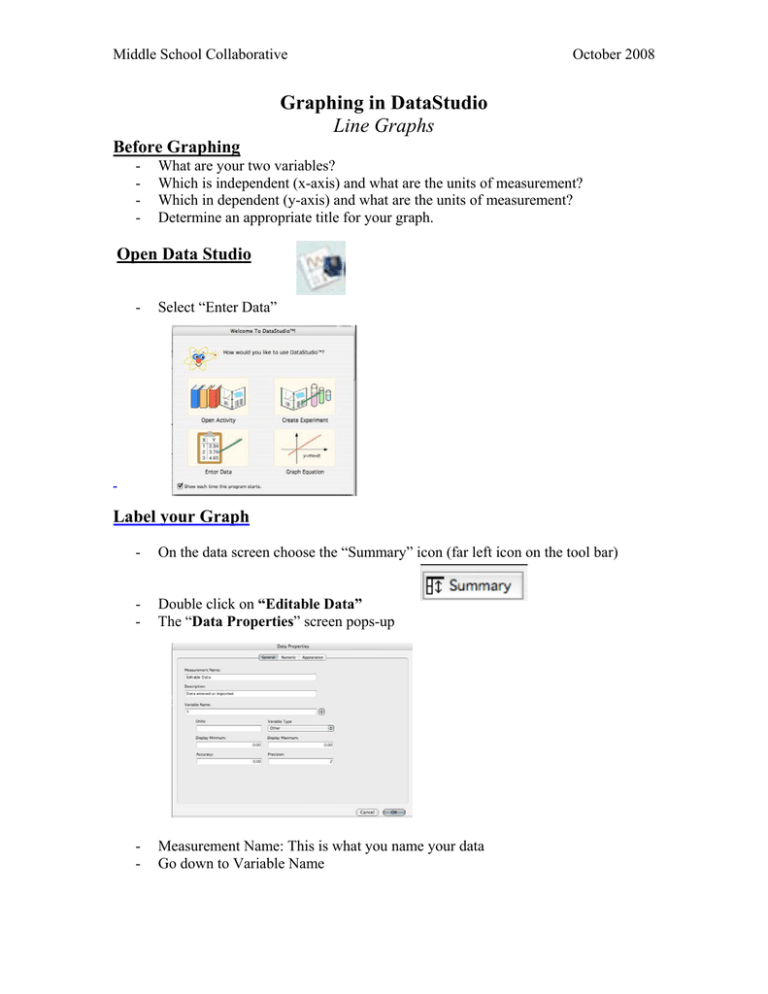
Middle School Collaborative October 2008 Graphing in DataStudio Line Graphs Before Graphing - What are your two variables? Which is independent (x-axis) and what are the units of measurement? Which in dependent (y-axis) and what are the units of measurement? Determine an appropriate title for your graph. Open Data Studio - Select “Enter Data” Label your Graph - On the data screen choose the “Summary” icon (far left icon on the tool bar) - Double click on “Editable Data” The “Data Properties” screen pops-up - Measurement Name: This is what you name your data Go down to Variable Name Middle School Collaborative - October 2008 Label the Y axis - Dependent Variable (include the appropriate units under variable name) Go to the arrow to select the X axis - Independent variable (include the appropriate units under variable name) Go to the “Appearance” tab in the Data Properties Screen Change “Data” to an appropriate name for your data This is where you can change the color of your lines and shape of your data points Click on OK Title Your Graph - Go to Graph 1 in the display section of the summary screen (click once, wait a second, click again). Label your graph appropriately Hit enter when done or your title will default back to "Graph 1" Entering your Data - Click on the “Summary” icon to get back to your table Enter your data in the appropriate columns - X-axis is the first column and the Yaxis is the second column. The Axes - To arrange the X and Y -axes you can either set maximums and minimums through the 'Graph Settings" under the Axis Setting tab. - Or if you place your curser near the X and Y-axis your cursor will turn into a hand. This allows you to move the graph around without changing the scale. If you place the curser above a number you'll see a double headed zigzag arrow. This tool allows you to change the scale of your axis by pulling it in either direction. Student Name and Class information - Select the Note Tool - Select a spot on the graph and click on it. The note tool opens and allows you to type. Printing a Graph - Make sure the graph window is selected before you print your graph otherwise the table will print. - You can have students create workbook (at the bottom of the summary screen), where they can place their data tables, graph, write a summary of the project and more.
