Lecture 2 Matlab Programs
advertisement

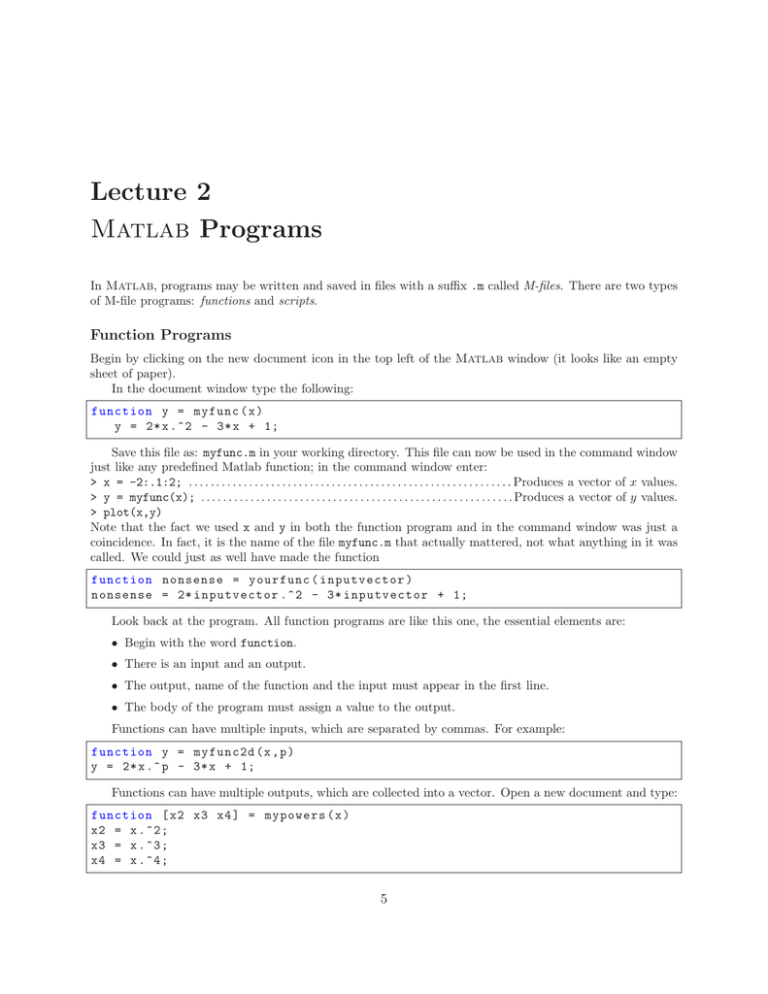
Lecture 2 Matlab Programs In Matlab, programs may be written and saved in files with a suffix .m called M-files. There are two types of M-file programs: functions and scripts. Function Programs Begin by clicking on the new document icon in the top left of the Matlab window (it looks like an empty sheet of paper). In the document window type the following: function y = myfunc ( x ) y = 2* x .^2 - 3* x + 1; Save this file as: myfunc.m in your working directory. This file can now be used in the command window just like any predefined Matlab function; in the command window enter: > x = -2:.1:2; . . . . . . . . . . . . . . . . . . . . . . . . . . . . . . . . . . . . . . . . . . . . . . . . . . . . . . . . . . . Produces a vector of x values. > y = myfunc(x); . . . . . . . . . . . . . . . . . . . . . . . . . . . . . . . . . . . . . . . . . . . . . . . . . . . . . . . . . Produces a vector of y values. > plot(x,y) Note that the fact we used x and y in both the function program and in the command window was just a coincidence. In fact, it is the name of the file myfunc.m that actually mattered, not what anything in it was called. We could just as well have made the function function nonsense = yourfunc ( inputvector ) nonsense = 2* inputvector .^2 - 3* inputvector + 1; Look back at the program. All function programs are like this one, the essential elements are: • Begin with the word function. • There is an input and an output. • The output, name of the function and the input must appear in the first line. • The body of the program must assign a value to the output. Functions can have multiple inputs, which are separated by commas. For example: function y = myfunc2d (x , p ) y = 2* x .^ p - 3* x + 1; Functions can have multiple outputs, which are collected into a vector. Open a new document and type: function [ x2 x3 x4 ] = mypowers ( x ) x2 = x .^2; x3 = x .^3; x4 = x .^4; 5 6 LECTURE 2. MATLAB PROGRAMS Save this file as mypowers.m. In the command window, we can use the results of the program to make graphs: > x = -1:.1:1 > [x2 x3 x4] = mypowers(x); > plot(x,x,’black’,x,x2,’blue’,x,x3,’green’,x,x4,’red’) Script Programs Matlab uses a second type of program that differs from a function program in several ways, namely: • There are no inputs and outputs. • A script program may use and change variables in the current workspace (the variables used by the command window.) Below is a script program that accomplishes the same thing as the function program plus the commands in the previous section: x2 = x .^2; x3 = x .^3; x4 = x .^4; plot (x ,x , ’ black ’ ,x , x2 , ’ blue ’ ,x , x3 , ’ green ’ ,x , x4 , ’ red ’) Type this program into a new document and save it as mygraphs.m. In the command window enter: > x = -1:.1:1; > mygraphs Note that the program used the variable x in its calculations, even though x was defined in the command window, not in the program. Many people use script programs for routine calculations that would require typing more than one command in the command window. They do this because correcting mistakes is easier in a program than in the command window. Program Comments For programs that have more than a couple of lines it is important to include comments. Comments allow other people to know what your program does and they also remind yourself what your program does if you set it aside and come back to it later. It is best to include comments not only at the top of a program, but also with each section. In Matlab anything that comes in a line after a % is a comment. For a function program, the comments should at least give the purpose, inputs, and outputs. A properly commented version of the function with which we started this section is: function y = myfunc ( x ) % Computes the function 2 x ^2 -3 x +1 % Input : x -- a number or vector ; % for a vector the computation is elementwise % Output : y -- a number or vector of the same size as x y = 2* x .^2 - 3* x + 1; For a script program it is often helpful to include the name of the program at the beginning. For example: 7 % mygraphs % plots the graphs of x , x ^2 , x ^3 , and x ^4 % on the interval [ -1 ,1] % fix the domain and evaluation points x = -1:.1:1; % calculate powers % x1 is just x x2 = x .^2; x3 = x .^3; x4 = x .^4; % plot each of the graphs plot (x ,x , ’+ - ’ ,x , x2 , ’x - ’ ,x , x3 , ’o - ’ ,x , x4 , ’ -- ’) The Matlab command help prints the first block of comments from a file. If we save the above as mygraphs.m and then do > help mygraphs it will print into the command window: mygraphs plots the graphs of x, x^2, x^3, and x^4 on the interval [-1,1] Exercises 2 2.1 Write a well-commented function program for the function x2 e−x , using entry-wise operations (such as .* and .^). To get ex use exp(x). Include adequate comments in the program. Plot the function on [−5, 5]. Turn in printouts of the program and the graph. 2.2 Write a well-commented script program that graphs the functions sin x, sin 2x, sin 3x, sin 4x, sin 5x and sin 6x on the interval [0, 2π] on one plot. (π is pi in Matlab.) Include comments in the program. Turn in the program and the graph.


