Federal State Local - The Pew Charitable Trusts
advertisement

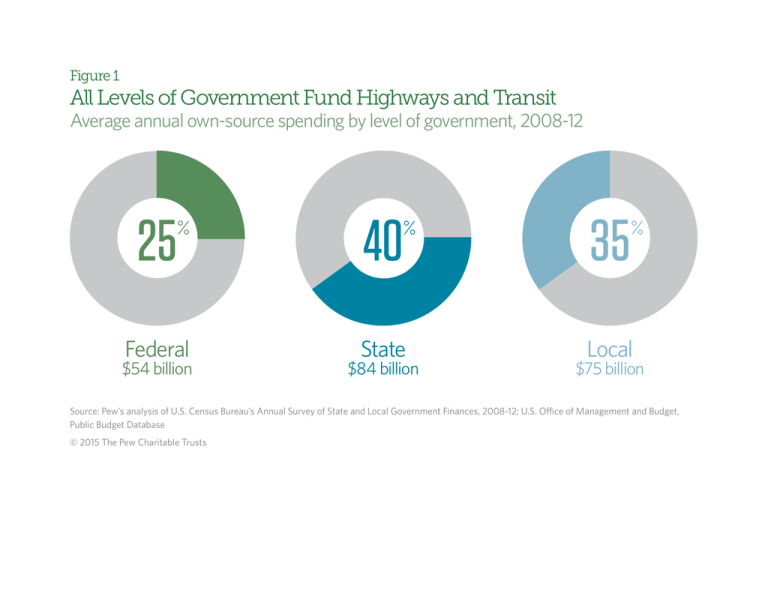
Figure 1 All Levels of Government Fund Highways and Transit Average annual own-source spending by level of government, 2008-12 35 Federal $54 billion State $84 billion Local $75 billion Source: Pew’s analysis of U.S. Census Bureau’s Annual Survey of State and Local Government Finances, 2008-12; U.S. Office of Management and Budget, Public Budget Database © 2015 The Pew Charitable Trusts Figure 2 Spending on Highways Exceeds That for Transit at Each Level of Government Share of spending, 2008-12 100% 90% 100% 100% 80% 90% 90% 70% 80% 80% 60% 70% 70% 50% 60% 19 19%% 81 19 81%% 81 19 20%% 81 19 80%% 81 39 40%% 39 Federal State Local Federal State Local Federal State Local % % 60% 40% 50% 50% 30% 40% % 61% 60%% 61 40% 20% 30% 30% 10% 20% 20% 0% 10% 10% 0% 0% Note: This figure excludes the roughly 2 percent of federal spending that flows directly to highway and transit infrastructure. Source: Pew’s analysis of U.S. Census Bureau’s Annual Survey of State and Local Government Finances, 2008-12 © 2015 The Pew Charitable Trusts Transit Highway Transit Transit Highway Highway Figure 3 Surface Transportation Funding Flows Among Levels of Government Spending on highways and transit, 2012 58 billion Own-source revenue $ Federal government Note: Numbers may not add up exactly due to rounding. 2 billion $ 45 billion $ 11 billion $ 89 billion $ State government 109 billion $ Transportation system $ 26 billion 73 billion $ Own-source flows Local government Intergovernmental transfers Sources: Pew’s analysis of U.S. Census Bureau’s Annual Survey of State and Local Government Finances, 2012; U.S. Office of Management and Budget, Public Budget Database © 2015 The Pew Charitable Trusts 109 billion $ Direct spending on transportation UT CA AZ Figures 4-6 WA ND Relative SignificanceWAof Federal Grants for Surface Transportation MT MN ND OR MT ME MN ID Varies by StateWAand RegionOR MT WI ND ME WA WA OR ND MT ID ND MN ID MN Federal share of total for highways and transit, OR funding MT MN ID WY OR of government, 2008-12 all levels SD ID WY SD NV WY NV WA NV OR ID CA MT UT CA WY CAUT NE NVWI NE CAUTIA CO WY SD NV WI CAUTMIIA NE CO CO ME IN OH KS SD WY ME SD WI UT CA OR NY highways and MI IA Federal expenditures for NE OH PA NY IN transit, perIAMIcapita, 2008-12 IL NE OH PA UT NY MI IA PAIN IL CO IL OH KS MO ND MT ID WV MO NM KY OK VAKY WI SD OK KY VA WY PA ME NY MI VA KY VALess than $150 NC NV TN$150 - $169 NC $170 -CA $199 SC SC AL$200 -GA $249 TNAR AZ NC MO WV VA TN AR NY AZ WI MS NC KS SD MO KY NMOK SC AL TNAR MI GA AZ $250 or greater LA NC TX MS PANMOK IA SC AL TN AR GA AZ NE OH NM LA IN TX MS IL OK SC GA AR VA WV FL ALLA NM $ TX MS KS MO KY GA FL AL AK U.S. average LA NC TXMS TN FL OK LA SCAK AR TX FL GA AK HI MS AL AK FL LA AK TX HI ND CO MN IL KS NV IA NE UT CO CA IL KS WV VA KY NC TN OK NM PA OH IN MO MS GA AL LA FL 167 HI Less than $150 AZ NM $150 - $169 $170 - $199 $200 - $249 $250 or greater AK FL HI Less than 23% Less than 23% Less than 23% 23% - 25% 23% - 25% 26% - 29% 30% - 36% 26% - 29% 25 HI AK 23% - 25% 26% - 29% 30% - 36% HI Less than 23% 23% - 25% 26% - 29% 30% - 36% % Less than 23% HI Less than 23% State and local expenditures for highways and transit, per capita, 2008-12 23% - 25% 26% - 29% U.S. average 23% - 25% 26% - 29% 30% - 36% 30% - 36% WA 37% or greater ID NV 37% or greater 30% - 36% AZ CO MI IA IL KS OK NM MO TX Source: Pew’s analysis of U.S. Census Bureau’s Annual Survey of State and Local 37% or greater Government Finances, 2008-12 PA OH IN WV VA KY NC TN SC AR MS 37% or greater © 2015 The Pew Charitable Trusts NY WI NE UT CA Note: Excludes federal spending directly on projects 37% or greater MN SD WY 37% or greater ME ND MT OR AL HI Less than $300 LA $300 - $399 $400 - $499 $500 - $599 $600 or greater 508 Less than $300 $300 - $399 $400 - $499 $500 - $599 $600 or greater GA FL AK ID UT SC AR AK M WV MO WV MN AKNY WV IN IL OH KS PA IN WA OR AZ AZCO WA MINY WI TX NV ME ME $ U.S. average AZ Figure 7 Surface Transportation Investment Is Declining Highway and transit spending by level of government, adjusted for inflation, 2002-12 120 Billions of 2012 dollars 100 80 60 $ 105 81 62 $ $ 89 73 56 50 $ $ $ $ 40 20 0 2002 State 2003 2004 Local 2005 Federal 2006 2007 2008 2009 2010 2011 2012 Recovery Act Notes: Inflation-adjusted using Bureau of Economic Analysis’ price index for state and local government investment in structures (Table 3.9.4, Line 36). Years are in state fiscal years. Excludes federal spending directly on projects. Sources: Pew’s analysis of U.S. Census Bureau’s Annual Survey of State and Local Government Finances, 2002-12; Recovery.gov agency-reported data, 2009-12 © 2015 The Pew Charitable Trusts Figure 8 Federal Highway Trust Fund Faces Growing Shortfalls Actual and projected revenue and outlays, 2000-25 60 Billions of dollars 50 40 30 20 10 0 ‘00 ‘01 ‘02 ‘03 ‘04 ‘05 ‘06 ‘07 ‘08 ‘09 ‘10 Revenue Actual outlays Projected revenue Projected outlays Transfers from general fund ‘11 ‘12 ‘13 ‘14 ‘15 ‘16 ‘17 ‘18 ‘19 ‘20 ‘21 ‘22 ‘23 ‘24 ‘25 Actual end-of-year balance Projected end-of-year balance Note: Numbers not adjusted for inflation. Source: Pew’s analysis of Congressional Budget Office and Federal Highway Administration data © 2015 The Pew Charitable Trusts Figure 9 Federal and State Governments Rely Heavily on Gas Tax Revenue to Fund Highways Resources used for highways, by level of government, 2012 100% 100% 7 % 90% 90% 80% 7% 12% %13 14% 13 14 19% 19 % 18% 18% 70% 13 % 60% 6% 66 % 15% 11% 50% 6 % 66 % 40% 50% 40% 15 31% 47% 21 % 20% 3% 4% Federal 30% 20% % 10% 0% State 31% Other taxes, fees, investment Other fees, investment income,taxes, and other receipts income, and other receipts Property taxes General fund Property taxes Tolls General fund Vehicle tax Tolls Fuel tax Vehicle tax 47% 21% 11% 30% Bond proceeds Bond proceeds Fuel tax 70% 60% % % 13% 80% 12 % Local Note: Local vehicle tax revenue includes a small amount of fuel revenue as well. Federal revenue is in federal fiscal years; revenue of state and local governments is in their own fiscal years or calendar years, depending on how they report their data to the Federal Highway Administration. Source: Pew’s analysis of Federal Highway Administration 2012 data (Tables HF-10, SDF, LDF, FE210). Local data are estimated by the Federal Highway Administration. © 2015 The Pew Charitable Trusts Figure 10 Gas Tax Revenue Has Fallen Over the Past Decade Federal and state fuel tax revenue, adjusted for inflation, 2002-12 60 State Federal Note: Inflation-adjusted using Bureau of Economic Analysis’ price index for state and local government investment in structures (Table 3.9.4, Line 36). Federal revenue is in federal fiscal years; state revenue is in state fiscal years or calendar years, depending on how states report their data to the Federal Highway Administration. Billions of 2012 dollars 50 40 30 20 Source: Pew’s analysis of Federal Highway Administration data, Tables FE-210 and SDF. 10 0 2002 2003 2004 2005 2006 2007 2008 2009 2010 State Federal 2011 2012 © 2015 The Pew Charitable Trusts


