Axis Options

Title
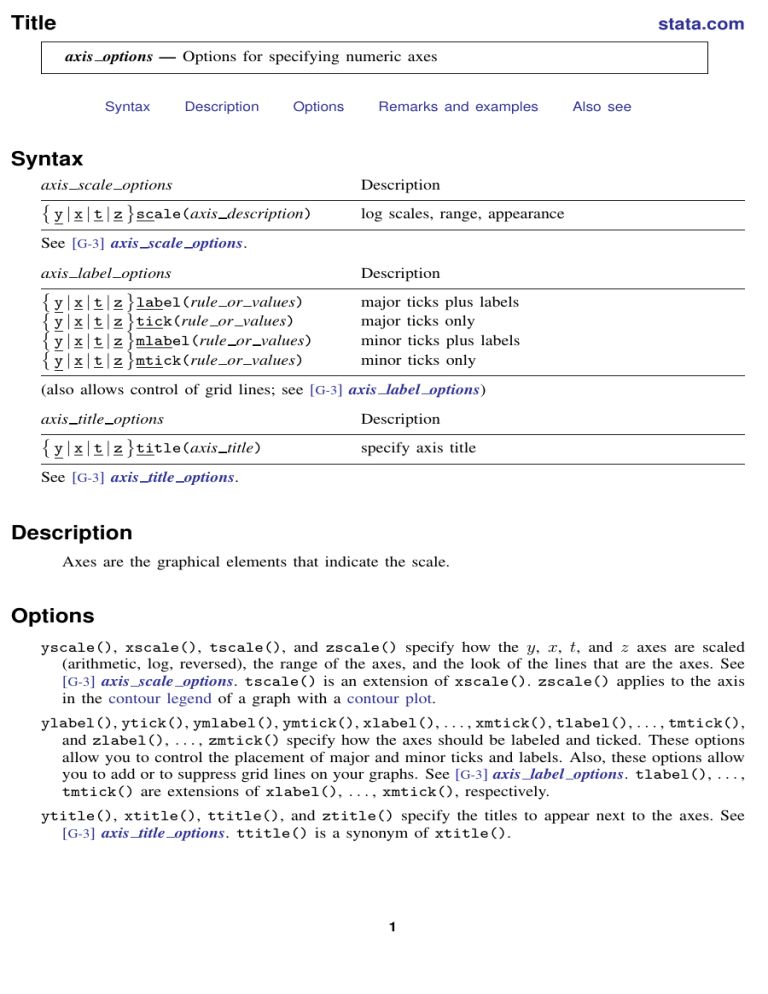
axis options — Options for specifying numeric axes
Syntax
axis scale options y
| x
| t
| z scale( axis description )
Description log scales, range, appearance
See [ G-3 ] axis scale options .
axis label options y
| x
| t
| z label( rule or values ) y | x | t | z tick( rule or values ) y
| x
| t
| z mlabel( rule or values ) y | x | t | z mtick( rule or values )
Description major ticks plus labels major ticks only minor ticks plus labels minor ticks only
(also allows control of grid lines; see [ G-3 ] axis label options ) axis title options y | x | t | z title( axis title )
See [ G-3 ] axis title options .
Description specify axis title
stata.com
Description
Axes are the graphical elements that indicate the scale.
Options
yscale() , xscale() , tscale() , and zscale() specify how the y , x , t , and z axes are scaled
(arithmetic, log, reversed), the range of the axes, and the look of the lines that are the axes. See
[ G-3 ] axis scale options .
tscale() is an extension of xscale() .
zscale() applies to the axis in the contour legend of a graph with a contour plot .
ylabel() , ytick() , ymlabel() , ymtick() , xlabel() , . . .
, xmtick() , tlabel() , . . .
, tmtick() , and zlabel() , . . .
, zmtick() specify how the axes should be labeled and ticked. These options allow you to control the placement of major and minor ticks and labels. Also, these options allow you to add or to suppress grid lines on your graphs. See [ G-3 ] axis label options .
tlabel() , . . .
, tmtick() are extensions of xlabel() , . . .
, xmtick() , respectively.
ytitle() , xtitle() , ttitle() , and ztitle() specify the titles to appear next to the axes. See
[ G-3 ] axis title options .
ttitle() is a synonym of xtitle() .
1
2
— Options for specifying numeric axes
Remarks and examples
stata.com
Numeric axes are allowed with graph twoway (see [ G-2 ] graph twoway ) and graph matrix (see
[ G-2 ] graph matrix ) and are allowed for one of the axes of graph bar (see [ G-2 ] graph bar ), graph dot (see [ G-2 ] graph dot ), and graph box (see [ G-2 ] graph box ). They are also allowed on the contour key of a legend on a contour plot . How the numeric axes look is affected by the axis options .
Remarks are presented under the following headings:
Use of axis-appearance options with graph twoway
Axis on the left, axis on the right?
Contour axes—zscale(), zlabel(), etc.
Use of axis-appearance options with graph twoway
When you type
. scatter yvar xvar the resulting graph will have y and x axes. How the axes look will be determined by the scheme; see [ G-4 ] schemes intro . The axis options allow you to modify the look of the axes in terms of whether the y axis is on the left or on the right, whether the x axis is on the bottom or on the top, the number of major and minor ticks that appear on each axis, the values that are labeled, and the titles that appear along each.
For instance, you might type
. scatter yvar xvar, ylabel(#6) ymtick(##10) ytitle("values of y") xlabel(#6) xmtick(##10) xtitle("values of x") to draw a graph of yvar versus xvar , putting on each axis approximately six labels and major ticks and 10 minor ticks between major ticks, and labeling the y axis “values of y” and the x axis “values of x”.
. scatter yvar xvar, ylabel(0(5)30) ymtick(0(1)30) ytitle("values of y") xlabel(0(10)100) xmtick(0(5)100) xtitle("values of x") would draw the same graph, putting major ticks on the y axis at 0, 5, 10, . . .
, 30 and minor ticks at every integer over the same range, and putting major ticks on the x axis at 0, 10, . . .
, 100 and minor ticks at every five units over the same range.
The way we have illustrated it, it appears that the axis options are options of scatter , but that is not so. Here they are options of twoway , and the “right” way to write the last command is
. twoway (scatter yvar xvar), ylabel(0(5)30) ymtick(0(1)30) ytitle("values of y") xlabel(0(10)100) xmtick(0(5)100) xtitle("values of x")
The parentheses around (scatter yvar xvar) and the placing of the axis-appearance options outside the parentheses make clear that the options are aimed at twoway rather than at scatter .
Whether you use the || -separator notation or the () -binding notation makes no difference, but it is important to understand that there is only one set of axes, especially when you type more complicated commands, such as
. twoway (scatter yvar xvar)
(scatter y2var x2var)
, ylabel(0(5)30) ymtick(0(1)30) ytitle("values of y") xlabel(0(10)100) xmtick(0(5)100) xtitle("values of x")
There is one set of axes in the above, and it just so happens that both yvar versus xvar and y2var versus x2var appear on it. You are free to type the above command how you please, such as
— Options for specifying numeric axes 3
. scatter yvar xvar || scatter y2var x2var ||, ylabel(0(5)30) ymtick(0(1)30) ytitle("values of y") xlabel(0(10)100) xmtick(0(5)100) xtitle("values of x") or
. scatter yvar xvar || scatter y2var x2var, ylabel(0(5)30) ymtick(0(1)30) ytitle("values of y") xlabel(0(10)100) xmtick(0(5)100) xtitle("values of x") or
. scatter yvar xvar, ylabel(0(5)30) ymtick(0(1)30) ytitle("values of y") xlabel(0(10)100) xmtick(0(5)100) xtitle("values of x") || scatter y2var x2var
The above all result in the same graph, even though the last makes it appear that the axis options are associated with just the first scatter , and the next to the last makes it appear that they are associated with just the second. However you type it, the command is really twoway .
twoway draws twoway graphs with one set of axes (or one set per by-group), and all the plots that appear on the twoway graph share that set.
Multiple y and x scales
Actually, a twoway graph can have more than one set of axes. Consider the command:
. twoway (scatter yvar xvar) (scatter y2var x2var, yaxis(2))
The above graphs yvar versus xvar and y2var versus x2var , but two y scales are provided. The first (which will appear on the left) applies to yvar , and the second (which will appear on the right) applies to y2var . The yaxis(2) option says that the y axis of the specified scatter is to appear on the second y scale.
See [ G-3 ] axis choice options .
Axis on the left, axis on the right?
When there is only one y scale, whether the axis appears on the left or the right is determined by the scheme; see [ G-4 ] schemes intro . The default scheme puts the y axis on the left, but the scheme that mirrors the style used by The Economist puts it on the right: scatter yvar xvar, scheme(economist)
Specifying scheme(economist) will change other things about the appearance of the graph, too.
If you just want to move the y axis to the right, you can type scatter yvar xvar, yscale(alt)
As explained in [ G-3 ] axis scale options , yscale(alt) switches the axis from one side to the other, so if you typed scatter yvar xvar, scheme(economist) yscale(alt) you would get The Economist scheme but with the y axis on the left.
xscale(alt) switches the x axis from the bottom to the top or from the top to the bottom; see
[ G-3 ] axis scale options .
4
— Options for specifying numeric axes
Contour axes—zscale(), zlabel(), etc.
The zscale() , zlabel() , ztitle() , and other z options are unusual in that they apply not to axes on the plot region, but to the axis that shows the scale of a contour legend . They have effect only when the graph includes a twoway contour plot; see [ G-2 ] graph twoway contour . In all other respects, they act like the x * , y * , and t * options.
Also see
[ G-3 ] axis choice options — Options for specifying the axes on which a plot appears
[ G-3 ] axis label options — Options for specifying axis labels
[ G-3 ] axis scale options — Options for specifying axis scale, range, and look
[ G-3 ] axis title options — Options for specifying axis titles
[ G-3 ] region options — Options for shading and outlining regions and controlling graph size


