Delay-time and aging effects on contrast and sensitivity of hydrogen
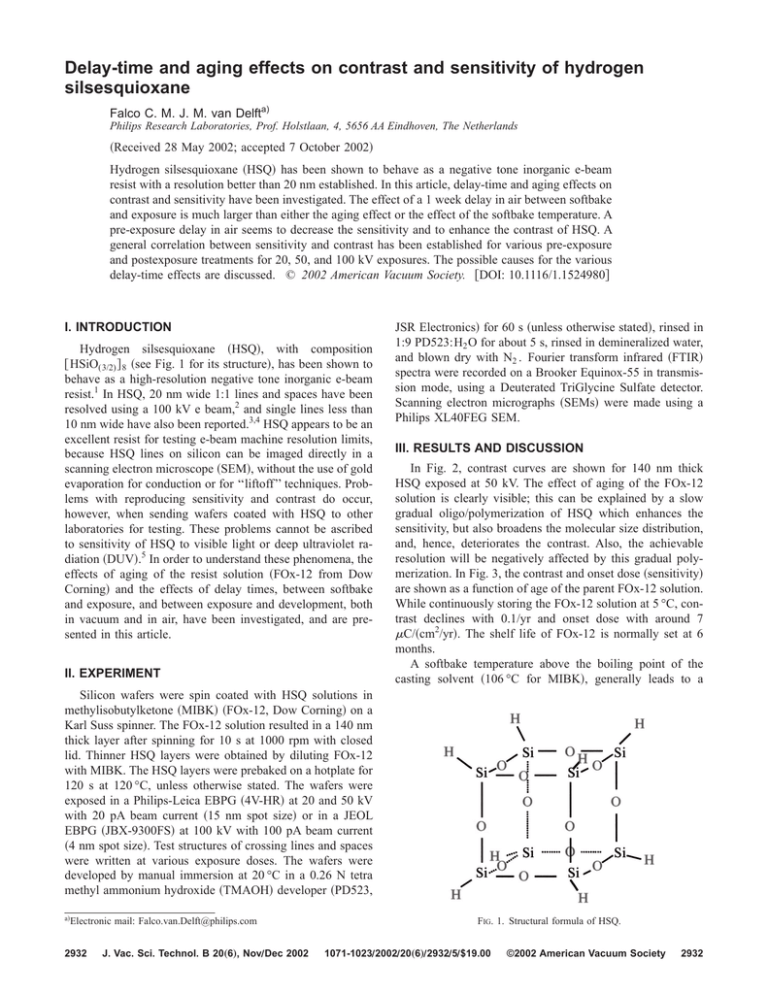
advertisement

Delay-time and aging effects on contrast and sensitivity of hydrogen silsesquioxane Falco C. M. J. M. van Delfta) Philips Research Laboratories, Prof. Holstlaan, 4, 5656 AA Eindhoven, The Netherlands 共Received 28 May 2002; accepted 7 October 2002兲 Hydrogen silsesquioxane 共HSQ兲 has been shown to behave as a negative tone inorganic e-beam resist with a resolution better than 20 nm established. In this article, delay-time and aging effects on contrast and sensitivity have been investigated. The effect of a 1 week delay in air between softbake and exposure is much larger than either the aging effect or the effect of the softbake temperature. A pre-exposure delay in air seems to decrease the sensitivity and to enhance the contrast of HSQ. A general correlation between sensitivity and contrast has been established for various pre-exposure and postexposure treatments for 20, 50, and 100 kV exposures. The possible causes for the various delay-time effects are discussed. © 2002 American Vacuum Society. 关DOI: 10.1116/1.1524980兴 I. INTRODUCTION Hydrogen silsesquioxane 共HSQ兲, with composition 关 HSiO(3/2) 兴 8 共see Fig. 1 for its structure兲, has been shown to behave as a high-resolution negative tone inorganic e-beam resist.1 In HSQ, 20 nm wide 1:1 lines and spaces have been resolved using a 100 kV e beam,2 and single lines less than 10 nm wide have also been reported.3,4 HSQ appears to be an excellent resist for testing e-beam machine resolution limits, because HSQ lines on silicon can be imaged directly in a scanning electron microscope 共SEM兲, without the use of gold evaporation for conduction or for ‘‘liftoff’’ techniques. Problems with reproducing sensitivity and contrast do occur, however, when sending wafers coated with HSQ to other laboratories for testing. These problems cannot be ascribed to sensitivity of HSQ to visible light or deep ultraviolet radiation 共DUV兲.5 In order to understand these phenomena, the effects of aging of the resist solution 共FOx-12 from Dow Corning兲 and the effects of delay times, between softbake and exposure, and between exposure and development, both in vacuum and in air, have been investigated, and are presented in this article. II. EXPERIMENT JSR Electronics兲 for 60 s 共unless otherwise stated兲, rinsed in 1:9 PD523:H2 O for about 5 s, rinsed in demineralized water, and blown dry with N2 . Fourier transform infrared 共FTIR兲 spectra were recorded on a Brooker Equinox-55 in transmission mode, using a Deuterated TriGlycine Sulfate detector. Scanning electron micrographs 共SEMs兲 were made using a Philips XL40FEG SEM. III. RESULTS AND DISCUSSION In Fig. 2, contrast curves are shown for 140 nm thick HSQ exposed at 50 kV. The effect of aging of the FOx-12 solution is clearly visible; this can be explained by a slow gradual oligo/polymerization of HSQ which enhances the sensitivity, but also broadens the molecular size distribution, and, hence, deteriorates the contrast. Also, the achievable resolution will be negatively affected by this gradual polymerization. In Fig. 3, the contrast and onset dose 共sensitivity兲 are shown as a function of age of the parent FOx-12 solution. While continuously storing the FOx-12 solution at 5 °C, contrast declines with 0.1/yr and onset dose with around 7 C/共cm2/yr兲. The shelf life of FOx-12 is normally set at 6 months. A softbake temperature above the boiling point of the casting solvent 共106 °C for MIBK兲, generally leads to a Silicon wafers were spin coated with HSQ solutions in methylisobutylketone 共MIBK兲 共FOx-12, Dow Corning兲 on a Karl Suss spinner. The FOx-12 solution resulted in a 140 nm thick layer after spinning for 10 s at 1000 rpm with closed lid. Thinner HSQ layers were obtained by diluting FOx-12 with MIBK. The HSQ layers were prebaked on a hotplate for 120 s at 120 °C, unless otherwise stated. The wafers were exposed in a Philips-Leica EBPG 共4V-HR兲 at 20 and 50 kV with 20 pA beam current 共15 nm spot size兲 or in a JEOL EBPG 共JBX-9300FS兲 at 100 kV with 100 pA beam current 共4 nm spot size兲. Test structures of crossing lines and spaces were written at various exposure doses. The wafers were developed by manual immersion at 20 °C in a 0.26 N tetra methyl ammonium hydroxide 共TMAOH兲 developer 共PD523, a兲 Electronic mail: Falco.van.Delft@philips.com 2932 J. Vac. Sci. Technol. B 20„6…, NovÕDec 2002 FIG. 1. Structural formula of HSQ. 1071-1023Õ2002Õ20„6…Õ2932Õ5Õ$19.00 ©2002 American Vacuum Society 2932 2933 Falco C. M. J. M. van Delft: Delay-time and aging effects on contrast 2933 FIG. 2. Effect of FOx-12 age 共days兲, softbake 共°C兲 and delay 共1 week in air between softbake and exposure兲 on contrast and sensitivity of 140 nm thick HSQ at 50 kV. FIG. 5. Effect of the SBT and various postexposure delay conditions on: 共a兲 contrast and 共b兲 onset dose for 140 nm thick HSQ exposed at 50 kV. FIG. 3. Contrast and onset dose as a function of age of the FOx-12 solution 共data from Fig. 2兲. FIG. 4. Effect of the softbake temperature 共SBT兲 and various pre-exposure delay conditions on: 共a兲 contrast and 共b兲 onset dose for 140 nm thick HSQ exposed at 50 kV. JVST B - Microelectronics and Nanometer Structures lower onset dose and a lower contrast 共Figs. 2, 4, and 5兲; this can be explained by a better compaction of the HSQ monomer cage molecules. The effect of a week pre-exposure delay in air between softbake and exposure, however, is much larger than either the aging effect or the effect of the softbake temperature, as can be seen in Fig. 2. A pre-exposure delay in air seems to enhance the contrast and diminish the sensitivity of HSQ, whereas aging diminishes its contrast and enhances its sensitivity. In Figs. 4共a兲 and 4共b兲, the effect is shown of the softbake temperature and a pre-exposure delay between softbake and exposure, in either vacuum or air, on contrast, and on the onset dose 共sensitivity兲, respectively. In Figs. 5共a兲 and 5共b兲, the effect is shown of the softbake temperature and a postexposure delay between exposure and development, in FIG. 6. Log D 0 vs the reciprocal contrast 1/␥ for collected contrast curves 共among others from Figs. 2–5兲 of 140 nm thick HSQ at various beam energies. The convergence point at 关 D c ,(d/d 0 ) c 兴 in the contrast curves can be deduced here from log D0⫽log Dc⫺(d/d0)c /␥. 2934 Falco C. M. J. M. van Delft: Delay-time and aging effects on contrast 2934 FIG. 7. FTIR spectra of a 100 nm thick layer of HSQ on a Si wafer: 共a兲 spectrum for sample after 30 min in air and 共b兲 differentiated spectra for sample after 30 min 共red兲 and after 3 weeks 共blue兲 in air. either vacuum or air, on contrast, and on the onset dose 共sensitivity兲, respectively. The various delay effects are less easily understood than the softbake and aging effects, and will be discussed below. Figure 6 shows that, at a given exposure energy, there is a general correlation between sensitivity and contrast for the J. Vac. Sci. Technol. B, Vol. 20, No. 6, NovÕDec 2002 various pre-exposure and postexposure treatments, softbake temperatures, and FOx-12 ages. By plotting log D0 共onset dose兲 versus the reciprocal contrast 1/␥ for all collected contrast data 共among others from Figs. 2–5兲, a common convergence point at 关 D c ,(d/d 0 ) c 兴 in the contrast curves can be deduced according to the equation for lines with a common 2935 Falco C. M. J. M. van Delft: Delay-time and aging effects on contrast 2935 FIG. 8. SEM graphs of lines and spaces at 100, 50, 30, and 20 nm pitch in 100 nm thick HSQ written at 100 kV with 3000 C/cm2. FIG. 9. SEM graphs of lines and spaces at 100, 50, 30, and 20 nm pitch in 30 nm thick HSQ written at 100 kV with 5000 C/cm2. convergence point: log D0⫽log Dc⫺(d/d0)c /␥. As (d/d 0 ) c ⬇1 within experimental accuracy, the convergence point indicates the minimum dose needed for full ‘‘polymerization’’/ network formation for a given resist thickness and e-beam energy 共in a large structure, taking full advantage of backscatter effects兲 independent of delay time and other effects. The various delay circumstances seem to affect the exposure and development in such a similar manner, that sensitivity and contrast are correlated. The delay-time effects could be related to small amounts of contaminants, which absorb in the HSQ layer during waiting. In the chemically amplified resists, for example, small amounts of airborne ammonia and amines are known to capture the H⫹ ions, generated by the photoacid generator during exposure, whose ions act as a catalyst for the polymerization or the decoupling of side groups. In order to investigate the possible role of such contaminants, FOx-12 solutions 共HSQ in MIBK兲 have been mixed with, and HSQ layers, softbaked at 120 °C, have been immersed in: an aqueous HCl solution, water, an aqueous KOH solution, 0.26 N TMAOH PD523 developer, concentrated ammonia, and diethylene triamine. The aqueous HCl solution and water do not react with FOx-12 and show hydrophobic behavior on the HSQ surface. The aqueous KOH solution and the PD523 developer react with FOx-12 under formation of gas bubbles and show hydrophilic behavior before dissolving the HSQ surface. Concentrated ammonia and diethylene triamine react with FOx-12 under formation of gas bubbles and fast gel formation, and show 共hydro/lyo兲philic behavior without dissolving the HSQ surface. Apparently, HSQ is quite stable in acid and does not readily adsorb or react with water. Hydroxide ions are responsible for the developing action of PD523. The gas bubbles can be ascribed to H2 formation, due to the reaction of the Si–H groups in HSQ with OH⫺ ions. Ammonia and amines, however, absorb and react readily, resulting in network formation. In order to investigate the possible role of ammonia, FTIR spectra have been measured of an HSQ layer on Si. In Fig. 7共a兲, the spectrum is shown after 30 min waiting in air following the 120 °C softbake. The signal at 2255 cm⫺1 is due to a Si–H stretch vibration, the signals at 565, 1124, and 1073 cm⫺1 are due to Si–O stretch vibrations, and the signals at 861 and 830 cm⫺1 are due to Si–O bend vibrations 共compare Fig. 1兲. In Fig. 7共b兲, the same spectrum is shown in differentiated form, together with the spectrum of an HSQ layer after 3 weeks waiting in air. The differentiation allows us to remove background signal differences between the various silicon wafers 共batch-to-batch difference in IR absorption兲. As can be seen in Fig. 7共b兲, within experimental error, there is no difference between these wafers with different delay times in air, and there is no evidence JVST B - Microelectronics and Nanometer Structures 2936 Falco C. M. J. M. van Delft: Delay-time and aging effects on contrast for the occurrence of Si–N or N–H vibrations 共at 3580– 3380, 1175, and 900 cm⫺1兲; neither is there any evidence for the presence of absorbed water or–OH groups 共4000–3000 cm⫺1兲. The delay-time effects between softbake and exposure may be ascribed to a slow gradual absorption of some contaminant 共not being water or NH3 ), which surrounds the HSQ monomers and hampers the network formation during exposure. A slow oxidation of the Si–H groups in the HSQ monomers without network formation is not very likely and this should have also resulted in differences in the FTIR spectra in Fig. 7共b兲. With a delay in vacuum, the effect is almost absent, as should be expected. The delay time effects between exposure and development are less obvious. The lowering of the onset dose in air can be explained by a slow propagation of the network formation during, e.g., oxidation. This is substantiated by the fact that the onset dose normally rises by doubling the developer time, but no longer changes if the development is repeated after 1 day of waiting in air between the two development steps. The delay effect in vacuum, however, is more difficult to understand. In high vacuum, H2 and CO are the main contaminants. Possible explanations are acceleration of the development step by the absorbed contaminants, or a reversion of the 共equilibrium兲 reaction forming the network due to the absence of oxygen and the presence of hydrogen. More experimental work, however, is necessary to elucidate these mechanisms. In Figs. 8 and 9 lines and spaces are shown in, respectively, 100 and 30 nm thick HSQ as written at 100 kV in the JEOL JBX-9300FS, after 1 week delay in air between softbake and exposure. At a pitch of 30 nm, the lines are still resolved, indicating that 15 nm 1:1 lines and spaces are feasible. IV. CONCLUSIONS In this article, delay-time and aging effects on contrast and sensitivity of HSQ have been investigated. The effect of J. Vac. Sci. Technol. B, Vol. 20, No. 6, NovÕDec 2002 2936 a 1 week delay in air between softbake and exposure is much larger than both the ageing effect and the effect of the softbake temperature. A pre-exposure delay in air seems to decrease the sensitivity and to enhance the contrast of HSQ. A general correlation between sensitivity and contrast has been established for various pre-exposure and postexposure treatments for 20, 50, and 100 kV exposures. The possible causes for the various delay-time effects are discussed in terms of contaminant absorption and slow propagation of the network formation. For HSQ, postexposure delay should be avoided, whereas pre-exposure delay in air helps in improving contrast. ACKNOWLEDGMENTS The author gratefully acknowledges the SEM assistance of Frans Holthuysen, the measurement of FTIR spectra by Rene Bakker 共Philips CFT, Analysis Department, Eindhoven, the Netherlands兲, the measurement of additional 100 kV contrast curve data by Anja van Langen-Suurling 共DIMES, Delft University of Technology, the Netherlands兲, and helpful discussions with Herman Meynen 共Dow Corning S.A., Seneffe, Belgium兲 and Markus Peuker 共MIT, Nanostructures Laboratory, Cambridge, MA兲. 1 H. Namatsu, T. Yamaguchi, M. Nagase, K. Yamasaki, and K. Kurihara, Microelectron. Eng. 41Õ42, 331 共1998兲. 2 F. C. M. J. M. van Delft, J. P. Weterings, A. K. van Langen-Suurling, and J. Romijn, J. Vac. Sci. Technol. B 18, 3419 共2000兲. 3 B. E. Maile, W. Henschel, H. Kurz, B. Rienks, R. Polman, and P. Kaars, Jpn. J. Appl. Phys., Part 1 39, 6836 共2000兲. 4 H. Namatsu, J. Vac. Sci. Technol. B 19, 2709 共2001兲. 5 M. Peuker, M. H. Lim, H. I. Smith, R. Morton, A. K. van LangenSuurling, J. Romijn, E. W. J. M. van der Drift, and F. C. M. J. M. van Delft, Microelectron. Eng. 61Õ62, 803 共2002兲.


