Frequency Domain Using Excel
advertisement

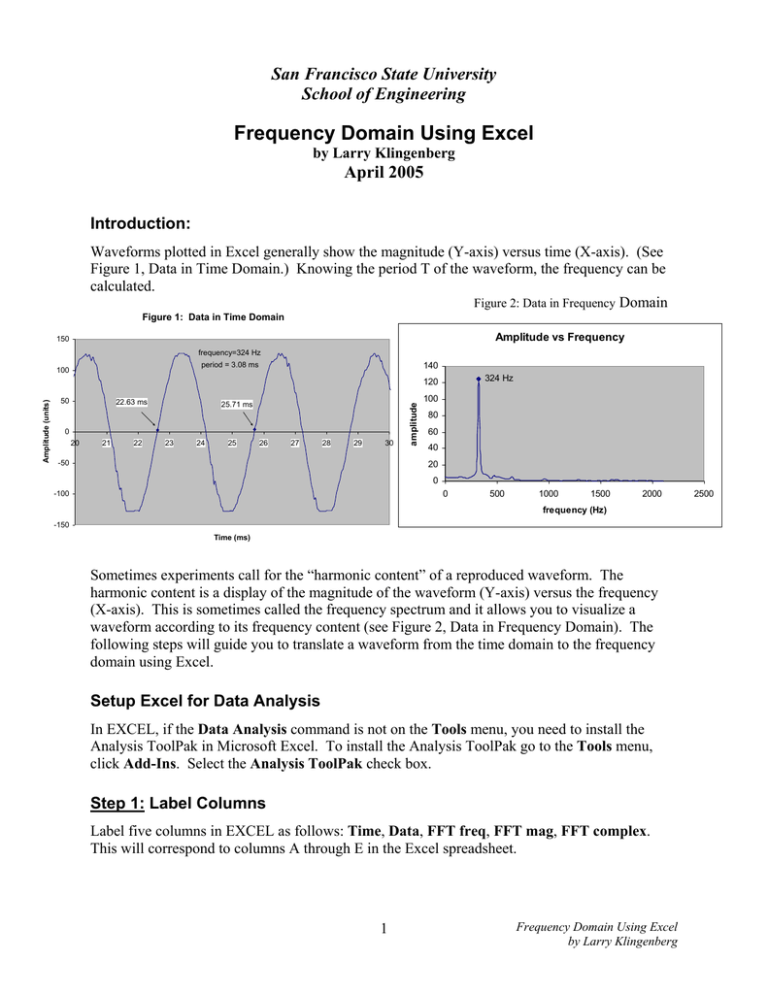
San Francisco State University School of Engineering Frequency Domain Using Excel by Larry Klingenberg April 2005 Introduction: Waveforms plotted in Excel generally show the magnitude (Y-axis) versus time (X-axis). (See Figure 1, Data in Time Domain.) Knowing the period T of the waveform, the frequency can be calculated. Figure 2: Data in Frequency Domain Figure 1: Data in Time Domain Amplitude vs Frequency 150 frequency=324 Hz period = 3.08 ms 100 140 324 Hz 50 22.63 ms 25.71 ms 0 20 21 22 23 24 25 26 27 28 29 30 -50 amplitude Amplitude (units) 120 100 80 60 40 20 0 0 -100 500 1000 1500 2000 frequency (Hz) -150 Time (ms) Sometimes experiments call for the “harmonic content” of a reproduced waveform. The harmonic content is a display of the magnitude of the waveform (Y-axis) versus the frequency (X-axis). This is sometimes called the frequency spectrum and it allows you to visualize a waveform according to its frequency content (see Figure 2, Data in Frequency Domain). The following steps will guide you to translate a waveform from the time domain to the frequency domain using Excel. Setup Excel for Data Analysis In EXCEL, if the Data Analysis command is not on the Tools menu, you need to install the Analysis ToolPak in Microsoft Excel. To install the Analysis ToolPak go to the Tools menu, click Add-Ins. Select the Analysis ToolPak check box. Step 1: Label Columns Label five columns in EXCEL as follows: Time, Data, FFT freq, FFT mag, FFT complex. This will correspond to columns A through E in the Excel spreadsheet. 1 Frequency Domain Using Excel by Larry Klingenberg 2500 Step 2: Import Data, determine sampling frequency, adjust number of samples to 2n Import the sampled data from your experiment into Time and Data. Let D correspond to the number of rows of data. Therefore, suppose in our example we have D=1000. Note the time interval, t, of the data by subtracting the number in the first cell in the Time column from the number in the last cell in the Time column. For example, after subtracting the last cell from the first cell, suppose the difference in the time interval t is 0.02 seconds. Determine the sampling frequency, fs by dividing number of data, D, by the time interval, t. In our example, suppose there are 1000 samples. fs = 50,000 D 1000 D = 1,000 Therefore, the sampling frequency fs = = = 50,000 samples/sec t 0.02 In the next step of Excel, one of the limitations of using the FFT function is that the number of data points operated on must be a number that is a power of two. For example, we must operate on either 256 data points (28), 512 data points (29), 1024 data points (210), 2048 data points (211) or any other power of two. In our hypothetical example, since 1000 data points is very close to 1024 data points, we could add dummy data by adding zeros in the Time and Data column to make 1024 data points. In the alternative, we could have used only the first 512 data points. Since we’ve decided to use 1024 data points (210 data points), add zeros in the Time and Data column from rows 1002 to 1025 as a filler. We now have 1024 “data points” even though the last 24 are zeros. This is done to enable the FFT function in Excel to work, otherwise an error results. Because we have chosen 210 data points, then let sa = 1024. Generally, the larger sa is, the better the accuracy. sa = 1024 Step 3: Fill in Column E called “FFT complex” Using Tools Æ Data Analysis Æ Fourier Analysis, enter the Input Range of the Data. In our example, we have 1024 data points (210) in column B. Therefore, in this example, Input Range is the data located at $B$2:$B$1025. Select the output range for the FFT complex number generated by Fourier Analysis to be located at $E$2:$E$1025. Select OK. Column E (called FFT complex) will now contain an FFT complex number. 2 Frequency Domain Using Excel by Larry Klingenberg Step 4: Fill in Column D called “FFT mag” Calculate the FFT magnitude (column D) by finding the absolute value of the FFT complex of column E and multiply it by 2/sa. In our example, sa=1024. Place the cursor in cell D2 and use the formula bar to enter the following formula: =2/1024 * IMABS(E2). Click the checkmark to the left of the formula to enter the formula into cell D2. Then drag the formula in D2 down (click on the tab of the lower right-hand corner of D2) to D1025. =2/1024*IMABS(E2) Drag this down to copy the formula to D1025 Step 5: Fill in Column C called “FFT freq” The first cell of the FFT freq (C2) is always zero. Enter 0 for cell C2. The second cell (C3) of the FFT freq is 1 x fs / sa, where fs is the sampling frequency (50,000 in this example), and sa is the number of 2n samples, 1024 in this example). Therefore, cell C3 is 1 x 50,000 / 1024 = 48.828125. The next cell C4 is 2 x fs / sa or 2 x 50,000/1024. The next cell C5 is 3 x fs/sa, and so on. Instead of manually filling in the rows, we can automatically fill the “FFT freq” column using the Excel Series function. Leave C2 as always zero. C3, calculated in our example, is 48.828125. To automatically fill from C3 down, make sure C3 is selected, use Edit Æ Fill Æ Series to automatically fill the remaining column as shown below. Step value = fs/sa Stop value = fs Do not round values up or down. Use all digits in the calculations. 3 Frequency Domain Using Excel by Larry Klingenberg 48.828125 fs 50000 48.828125 Step 6: Plot Waveform in the Frequency Domain Select values in columns C (FFT freq) and D (FFT mag) and plot using Chart Wizard as usual using XY (Scatter plot). Plotting more rows is not necessarily better, depending on the plot results desired. Experiment creating different plots: with the first 128 rows; with the first 256 rows; with the first 512 rows; etc. The plots will be the frequency spectrum (magnitude vs frequency) with different views. See sample below. Or try first 100 rows, first 200 rows, first 300 rows, etc. Do not plot more than sa/2 rows. If more than sa/2 rows are plotted, the FFT representation begins to duplicate itself. 4 Frequency Domain Using Excel by Larry Klingenberg Example Of A Voice Pattern Plotted With Different Number Of Rows FFT Vowel A: 64 Samples 0.14 0.12 0.1 0.08 0.06 0.04 0.02 0 -0.02 0 Magnitude Magnitude FFT Vowel A: 512 samples 390 Hz 5000 10000 15000 20000 25000 0.14 0.12 0.1 0.08 0.06 0.04 0.02 0 390 Hz 0 30000 1000 FFT Vowel A: 32 samples Magnitude Magnitude FFT Vowel A: 256 samples 390 Hz 0 5000 3000 Frequency Frequency 0.14 0.12 0.1 0.08 0.06 0.04 0.02 0 2000 10000 15000 0.14 0.12 0.1 0.08 0.06 0.04 0.02 0 390 Hz 0 Frequency 500 1000 1500 2000 Frequency Magnitude FFT Vowel A: 128 samples 0.14 0.12 0.1 0.08 0.06 0.04 0.02 0 390 Hz 0 2000 4000 6000 8000 Frequency 5 Frequency Domain Using Excel by Larry Klingenberg 4000


