RC Circuit Decay - Saddleback College
advertisement

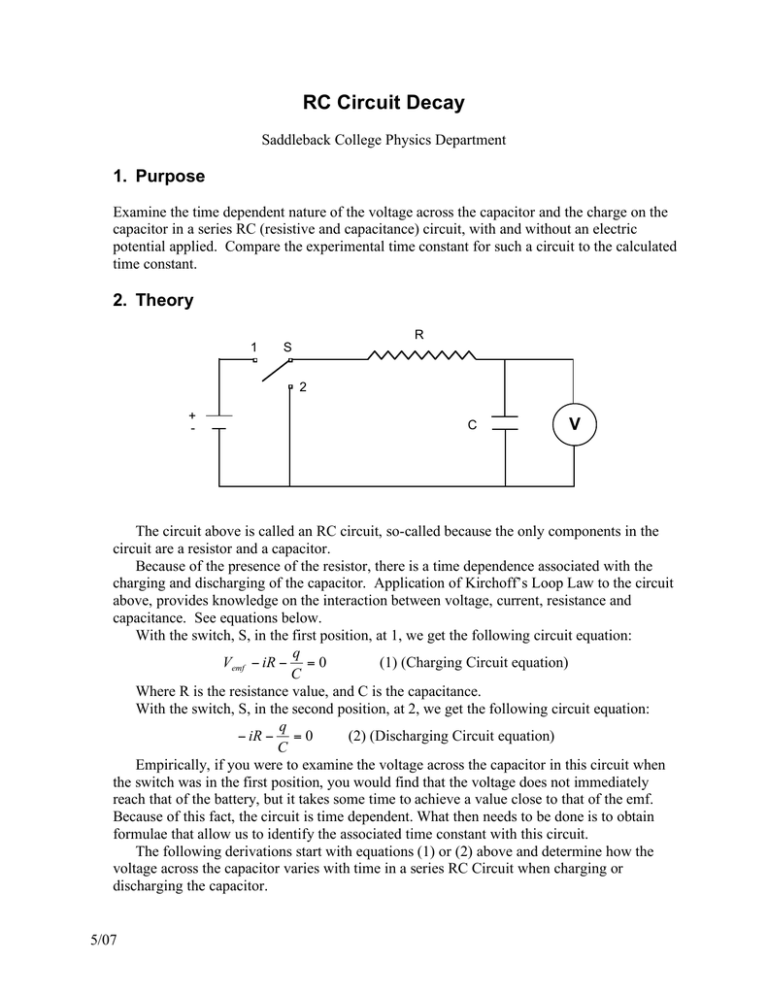
RC Circuit Decay Saddleback College Physics Department 1. Purpose Examine the time dependent nature of the voltage across the capacitor and the charge on the capacitor in a series RC (resistive and capacitance) circuit, with and without an electric potential applied. Compare the experimental time constant for such a circuit to the calculated time constant. 2. Theory 1 R S 2 + - C V The circuit above is called an RC circuit, so-called because the only components in the circuit are a resistor and a capacitor. Because of the presence of the resistor, there is a time dependence associated with the charging and discharging of the capacitor. Application of Kirchoff’s Loop Law to the circuit above, provides knowledge on the interaction between voltage, current, resistance and capacitance. See equations below. With the switch, S, in the first position, at 1, we get the following circuit equation: q Vemf ! iR ! = 0 (1) (Charging Circuit equation) C Where R is the resistance value, and C is the capacitance. With the switch, S, in the second position, at 2, we get the following circuit equation: q ! iR ! = 0 (2) (Discharging Circuit equation) C Empirically, if you were to examine the voltage across the capacitor in this circuit when the switch was in the first position, you would find that the voltage does not immediately reach that of the battery, but it takes some time to achieve a value close to that of the emf. Because of this fact, the circuit is time dependent. What then needs to be done is to obtain formulae that allow us to identify the associated time constant with this circuit. The following derivations start with equations (1) or (2) above and determine how the voltage across the capacitor varies with time in a series RC Circuit when charging or discharging the capacitor. 5/07 Charging Formula Derivation Noting that (1) can be written: Vemf ! dq q R + ; Vemf Cdt = dqRC + qdt ; dt C 1 dq (Vemf C ! q )dt = dqRC ; ! dt = RC Vemf C ! q 1 dq t " ! RC dt = " Vemf C ! q ; ! RC + Const. = ln q ! Vemf C Exponentiating both sides: Solving for dq : dt dq q R ! = 0 ; q = 0, t = 0 dt C Vemf = ke ! t RC = q ! Vemf C ; q = 0, t = 0; k = Vemf C q = Vemf C (1 ! e ! t RC ) Multiplying through by 1/C returns: V (T ) = Vemf (1 ! e (3) ! t RC ) RC Circuit, Charging Discharging Formula Derivation: dq di dq di i = i; ! R! = 0 Deriving (2) with respect to t: ! R ! dt = 0 ; dt C dt dt C di di i =! Solving for : ; Using the method of separating variables for solving this dt dt RC di dt t =! +k . differential equation: => ln i = ! i RC RC Solving for i: i = e ! t +k RC ! , e k = io (where io = initial current) t Simplifying: i = io e RC If we multiply through by R, then we end up with: t ! RC emf (4) RC Circuit, Discharging V =V Notes: RC = ! e = time constant, Half-Life of Charge Decay: t 1 = RC ln 2 5/07 1 2 3. Equipment Voltmeter Capacitor(s) Resistor(s) (~82 kOhm – 100 kOhm) RC LabNet Circuit Board Battery or D.C. Power Supply (NOT TO EXCEED 10 VOLTS) Test Leads & adapters Stopwatch 4. Procedure a. Set up the circuit according to the schematic shown below. If you are using the RC LabNet Boards, learn how the board is laid out by examining the top and bottom sides of the board to understand where/how current flows etc. Choose a value of R and C that provide a time constant ! around 60 to 90 seconds. 1 R S 2 + - C V b. Charging Procedure i. Simultaneously place the switch in the charging position (1 above) and begin the stopwatch. ii. At 10-second intervals, record the voltage reading from the Voltmeter. iii. Record at least 10 intervals. iv. Repeat at least 2 times c. Discharging Procedure i. Fully charge the capacitor by shorting out the resistor. This will put maximum charge on the capacitor. ii. Take the short off of the resistor and throw the switch into the discharging position (2 above) while simultaneously starting your stopwatch. iii. At 10-second intervals, record the voltage reading from the Voltmeter iv. Record at least 10 intervals v. Repeat at least 2 times d. Repeat each process again with new values of R and C 5/07 5. Analysis and Results a. Using Excel, plot V vs. t for both charging and discharging processes. & V #! b. Again, using Excel, plot ln$1 ' vs. t for each charging process. Plot the $ V ! emf " % best-fit line (linear fit) and display the equation of that line on the graph. From the slope of the graph, carefully determine the experimental time constant for the charging circuit. Note: It will be necessary to write equation (3) as the equation of a straight line in order to determine ! exp . V vs. t for each discharging process. Plot the bestVemf fit line (linear fit) and display the equation of that line on the graph. From the slope of the graph, carefully determine the experimental time constant for the discharging circuit. Note: It will be necessary to write equation (4) as the equation of a straight line in order to determine ! exp . c. Again, using Excel, plot ln 6. Questions a. Compare your experimental time constant with the theoretical time constant. b. Are your plots of V vs. t for both processes logarithmic in nature? 5/07


