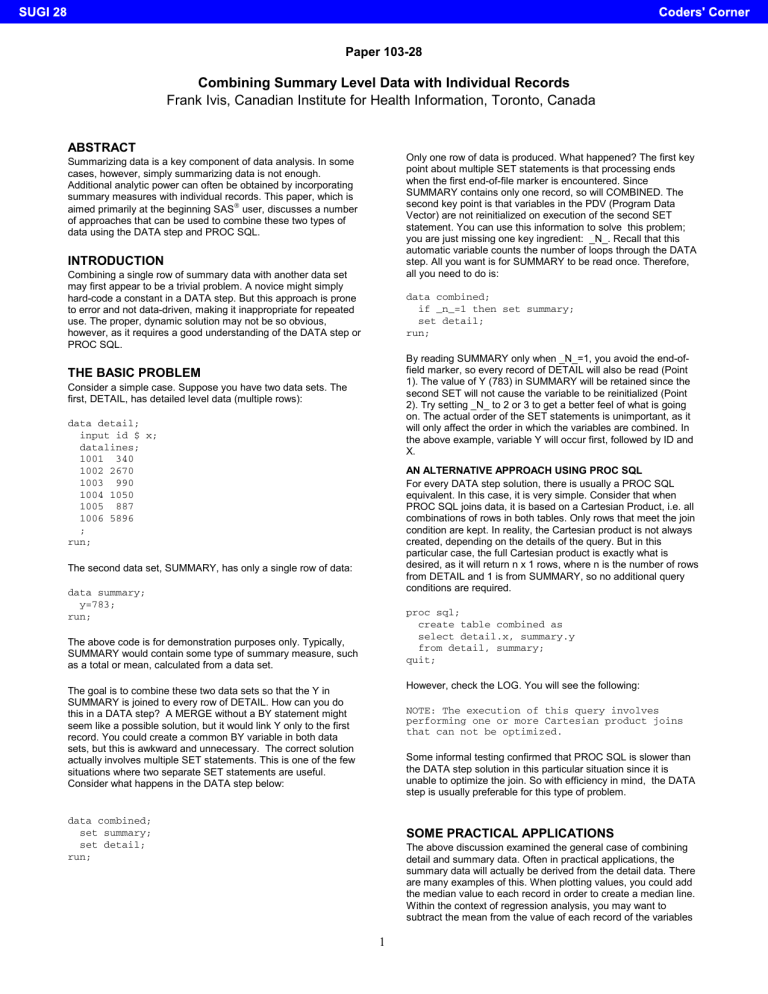
Combining Summary Level Data with Individual Records

SUGI 28 Coders' Corner
Paper 103-28
Combining Summary Level Data with Individual Records
Frank Ivis, Canadian Institute for Health Information, Toronto, Canada
ABSTRACT
Summarizing data is a key component of data analysis. In some cases, however, simply summarizing data is not enough.
Additional analytic power can often be obtained by incorporating summary measures with individual records. This paper, which is aimed primarily at the beginning SAS user, discusses a number of approaches that can be used to combine these two types of data using the DATA step and PROC SQL.
INTRODUCTION
Combining a single row of summary data with another data set may first appear to be a trivial problem. A novice might simply hard-code a constant in a DATA step. But this approach is prone to error and not data-driven, making it inappropriate for repeated use. The proper, dynamic solution may not be so obvious, however, as it requires a good understanding of the DATA step or
PROC SQL.
THE BASIC PROBLEM
Consider a simple case. Suppose you have two data sets. The first, DETAIL, has detailed level data (multiple rows): data detail;
input id $ x;
datalines;
1001 340
1002 2670
1003 990
1004 1050
1005 887
1006 5896
; run;
The second data set, SUMMARY, has only a single row of data: data summary;
y=783; run;
The above code is for demonstration purposes only. Typically,
SUMMARY would contain some type of summary measure, such as a total or mean, calculated from a data set.
The goal is to combine these two data sets so that the Y in
SUMMARY is joined to every row of DETAIL. How can you do this in a DATA step? A MERGE without a BY statement might seem like a possible solution, but it would link Y only to the first record. You could create a common BY variable in both data sets, but this is awkward and unnecessary. The correct solution actually involves multiple SET statements. This is one of the few situations where two separate SET statements are useful.
Consider what happens in the DATA step below: data combined;
set summary;
set detail; run;
1
Only one row of data is produced. What happened? The first key point about multiple SET statements is that processing ends when the first end-of-file marker is encountered. Since
SUMMARY contains only one record, so will COMBINED. The second key point is that variables in the PDV (Program Data
Vector) are not reinitialized on execution of the second SET statement. You can use this information to solve this problem; you are just missing one key ingredient: _N_. Recall that this automatic variable counts the number of loops through the DATA step. All you want is for SUMMARY to be read once. Therefore, all you need to do is: data combined;
if _n_=1 then set summary;
set detail; run;
By reading SUMMARY only when _N_=1, you avoid the end-offield marker, so every record of DETAIL will also be read (Point
1). The value of Y (783) in SUMMARY will be retained since the second SET will not cause the variable to be reinitialized (Point
2). Try setting _N_ to 2 or 3 to get a better feel of what is going on. The actual order of the SET statements is unimportant, as it will only affect the order in which the variables are combined. In the above example, variable Y will occur first, followed by ID and
X.
AN ALTERNATIVE APPROACH USING PROC SQL
For every DATA step solution, there is usually a PROC SQL equivalent. In this case, it is very simple. Consider that when
PROC SQL joins data, it is based on a Cartesian Product, i.e. all combinations of rows in both tables. Only rows that meet the join condition are kept. In reality, the Cartesian product is not always created, depending on the details of the query. But in this particular case, the full Cartesian product is exactly what is desired, as it will return n x 1 rows, where n is the number of rows from DETAIL and 1 is from SUMMARY, so no additional query conditions are required.
proc sql;
create table combined as
select detail.x, summary.y
from detail, summary; quit;
However, check the LOG. You will see the following:
NOTE: The execution of this query involves performing one or more Cartesian product joins that can not be optimized.
Some informal testing confirmed that PROC SQL is slower than the DATA step solution in this particular situation since it is unable to optimize the join. So with efficiency in mind, the DATA step is usually preferable for this type of problem.
SOME PRACTICAL APPLICATIONS
The above discussion examined the general case of combining detail and summary data. Often in practical applications, the summary data will actually be derived from the detail data. There are many examples of this. When plotting values, you could add the median value to each record in order to create a median line.
Within the context of regression analysis, you may want to subtract the mean from the value of each record of the variables
SUGI 28 Coders' Corner that comprise interaction terms so that they are ‘centered’. If your data consists of counts, you can use the sum to calculate the proportion of the total that they represent. A recent presentation by Cody (2002) used summary data in a novel way in the context of data cleaning. The potential applications are endless. In all these situations, the fact that the summary data are derived from the detail data allows you a few more options in addition to the basic methods described earlier.
AN ALTERNATIVE APPROACH USING PROC SQL
Assume that the values of X in DETAIL are counts, and you would like to know what percentage of the total count they represent. PROC SQL provides a neat solution: proc sql;
create table combined as
select id, x,(x/sum(x))*100 as percent
from detail; quit;
PROC SQL is very flexible when it comes to summarizing data. In this instance, it can interpret your intentions very simply. If you request only a summary variable, for example, sum(x), it would return only a single record, that of the sum. However, since you are selecting detailed records as well, two passes through the data are made: one to calculate the summary statistic and the other to remerge it back to the individual rows. Note also that you do not have to explicitly KEEP or DROP the sum of X - you use it only for the purpose of calculating PERCENT. If you run this code, you will see the following note in the log:
NOTE: The query requires remerging summary statistics back with the original data.
This remerging is actually a SAS enhancement that is not typically available in standard SQL. The more general approach would be to first calculate the sum and then combine it with all the rows in a separate step as follows: proc sql;
create view sum_view as
select sum(x) as sum_x
from combined;
create table combined as
select id, x, (x/sum_x)*100 as percent
from detail,sum_view; quit;
In the above example, the sum of X is calculated using a view called SUM_VIEW. In the second SELECT statement, PERCENT is calculated using SUM_X from the view SUM. This approach is also more general, in that the summary measure does not have to be derived from the same detailed data.
A MORE GENERAL APPROACH
What if the summary measure that you want cannot be produced with PROC SQL? Just choose your favorite PROC that does calculate it, output a data set of that summary variable, then incorporate it via the DATA step as described earlier. This example will join the median of X in DETAIL to all the records of
DETAIL: proc means data=detail median noprint;
var x;
output out=med(drop=_:)median=median_x; run; data combined;
if _n_=1 then set med;
set detail; run;
2
Using PROC MEANS, you simply output a data set called MED which contains the variable MEDIAN_X. Note the data set option to drop the automatic variables _FREQ_ and _TYPE_ that are produced by PROC MEANS. Once you have MED, combining it with DETAIL is easy. This solution is perhaps the most general and flexible, as it can combine summary measures from any
PROC from any data set.
The above example could also take advantage of ODS. Although slightly more complicated, it is also more flexible. Here is an alternate solution to the same problem: ods listing close; ods trace on;
proc means data=detail (obs=1);
var x;
run; ods trace off; ods output means.summary=work.med; proc means data=detail median ;
var x; run; data combined;
set detail;
if _n_=1 then set med; run; ods listing;
The first line simply prevents the listing from being sent to the
Output window; you don't need to see it. ODS TRACE ON…ODS
TRACE OFF is used to determine the names of the various output objects for PROC MEANS. These are written to the SAS log. From the log, you can determine that the output object of interest is called SUMMARY. Since the actual PROC MEANS output is of no interest at this point, obs=1 is used to increase efficiency. To specify an output object, you can use the name, label, full path, partial path, label path or partial label path, or a mixture of labels and paths. For example, you could use
"SUMMARY STATISTICS", MEANS.SUMMARY (used above) or just SUMMARY. You then use the ODS OUTPUT statement to specify the temporary data set WORK.MEDIAN. This is where the output for the following PROC MEANS will be stored. In this case, it will only be the median, as it is the only statistic specified on the
PROC MEANS statement. By default, PROC MEANS assigns the name X_MEDIAN, but you could have specified another variable name. The final DATA step is the same as the previous example, except the two SET statements are reversed, so the median will appear last in the data set. The next line, ODS LISTING turns the
LISTING back on, allowing any future output to be displayed in the Output window.
USING ONLY A SINGLE DATA STEP
What if you have a unique, custom formula for your summary statistic or you just like doing everything in a single DATA step?
You could do something like the following: data combined;
if _n_=1 then
do until (last);
set detail (keep=x) end=last;
x_sum+(x*1.5);
end;
set detail; run;
If you take out the DO…UNTIL loop, the code will look very familiar. But in this instance, you don't have a summary value in a data set that you can merge. Instead, you calculate the summary statistic within the DO…UNTIL loop. Note the END=LAST on the
SUGI 28 Coders' Corner
SET statement, the LAST after DO UNTIL and the absence of an
OUTPUT statement. What will happen is that on the first iteration of the DATA step (IF _N_=1), the value X_SUM will be calculated for all values of X, although only the last value will be kept. This value will be retained when all values of DETAIL are read in on the second SET statement.
WHAT ABOUT A MACRO SOLUTION?
By now, you should be convinced that a macro solution is unnecessary for this problem. It is, in fact, redundant, as it will add an extra step. The only real reason to use such an approach is if a macro variable containing the summary value is required for some other purpose. The example below uses a macro variable to calculate a new variable (DIFF_X), and to display the median value in the title.
proc means data=detail median noprint;
var x;
output out=med(drop=_:)median=median_x; run;
/* Extra DATA step for Macro solution */ data _null_;
set med;
call symput (‘med_x’, compress(median_x)); run; data combined;
set detail;
diff_x=x-&med_x; run; title "Variables X and Diff_x, Median=&med_x"; proc print data=combined noobs;
var x diff_x; run;
The PROC MEANS is the same as in the earlier example. The
CALL SYMPUT is used to create the macro variable MED_X based on the variable MEDIAN_X. In the final DATA step, the new variable DIFF_X is created by subtracting MED_X from every observation of X. The final PROC PRINT lists the values of
X and DIFF_X . The macro variable MED_X in the title statement displays the median value.
CONCLUSION
Combining summary and detail data is a valuable data management skill. Creating data-driven solutions reduces the chance for error and simplifies coding. Understanding the processes involved in linking such data also provides valuable insight into the workings of the DATA step and PROC SQL.
Although the core ideas presented in this paper are straightforward, the variations and practical applications are unlimited.
REFERENCES
Cody, R. (2002). Data Cleaning 101, Proceedings for the Twenty-
Seventh SAS User Group International Conference . Cary, NC:
SAS Institute Inc.
SAS Institute Inc. (2000). SAS Programming III: Advanced
Techniques Course Notes. Cary, NC: SAS Institute Inc.
SAS Institute Inc. (1989). SAS Guide to the SQL Procedure:
Usage and Reference, Version 6. (First ed.). Cary, NC: SAS
Institute Inc.
ACKNOWLEDGMENTS
I would like to thank Alex Kopp of the Institute for Clinical
Evaluative Sciences for his insightful comments on an earlier draft of this paper.
3
CONTACT INFORMATION
Your comments and questions are valued and encouraged.
Contact the author at:
Frank Ivis
Canadian Institute for Health Information
90 Eglinton Avenue East, Suite 300
Toronto, Ontario M4P 2Y3
CANADA
Work Phone: (416) 481-2002
Fax: (416) 481-2950
Email: fivis@cihi.ca
SAS and all other SAS Institute Inc. product or service names are registered trademarks or trademarks of SAS Institute Inc. in the
USA and other countries. ® indicates USA registration.
Other brand and product names are trademarks of their respective companies.


