EE 508 Laboratory Experiment 1
advertisement

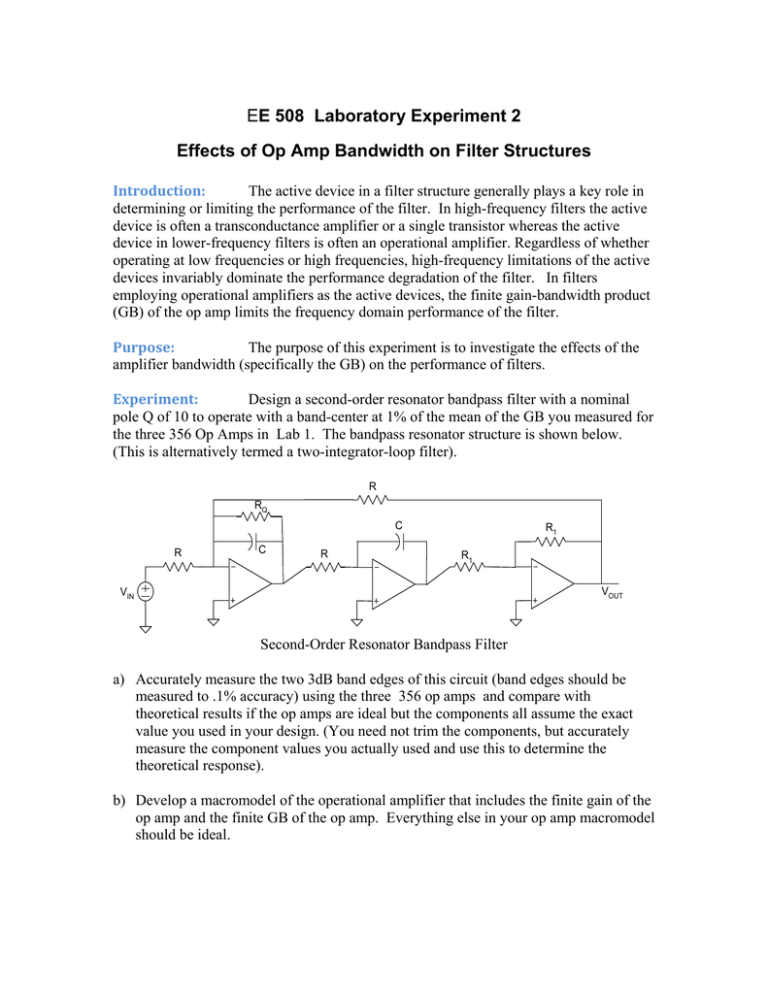
EE 508 Laboratory Experiment 2 Effects of Op Amp Bandwidth on Filter Structures Introduction: The active device in a filter structure generally plays a key role in determining or limiting the performance of the filter. In high-frequency filters the active device is often a transconductance amplifier or a single transistor whereas the active device in lower-frequency filters is often an operational amplifier. Regardless of whether operating at low frequencies or high frequencies, high-frequency limitations of the active devices invariably dominate the performance degradation of the filter. In filters employing operational amplifiers as the active devices, the finite gain-bandwidth product (GB) of the op amp limits the frequency domain performance of the filter. Purpose: The purpose of this experiment is to investigate the effects of the amplifier bandwidth (specifically the GB) on the performance of filters. Experiment: Design a second-order resonator bandpass filter with a nominal pole Q of 10 to operate with a band-center at 1% of the mean of the GB you measured for the three 356 Op Amps in Lab 1. The bandpass resonator structure is shown below. (This is alternatively termed a two-integrator-loop filter). R RQ C R C R R1 R1 VOUT VIN Second-Order Resonator Bandpass Filter a) Accurately measure the two 3dB band edges of this circuit (band edges should be measured to .1% accuracy) using the three 356 op amps and compare with theoretical results if the op amps are ideal but the components all assume the exact value you used in your design. (You need not trim the components, but accurately measure the component values you actually used and use this to determine the theoretical response). b) Develop a macromodel of the operational amplifier that includes the finite gain of the op amp and the finite GB of the op amp. Everything else in your op amp macromodel should be ideal. c) Using SPECTRE, simulate the frequency response of the filter first assuming that the Op Amp is ideal and then using a single-pole macro model of the op with the GB parameters you measured and with the dc gain obtained from the datasheet. How do the measured values of the band edges compare with the values predicted by the simulation using the op amp macro model? d) Replace the three 356 op amps with the three 741 op amps with the highest GB you measured in the first laboratory experiment.. Plot the measured magnitude response. Accurately compare the band edges of this filter with what you obtained with the 356 op amps. Reconcile the differences you observed in the two measurement with simulation results obtained by using the op amp macro models. e) Increase the band edges by a factor or 4 above what you obtained in part a) by scaling the frequency dependent components without changing the pole Q. How does the bandwidth and measured Q change? Is this change expected? Be quantitative and support any observations with simulations using the appropriate macromodel of the op amp.


