Create Sine Wave in Excel: Step-by-Step Tutorial
advertisement

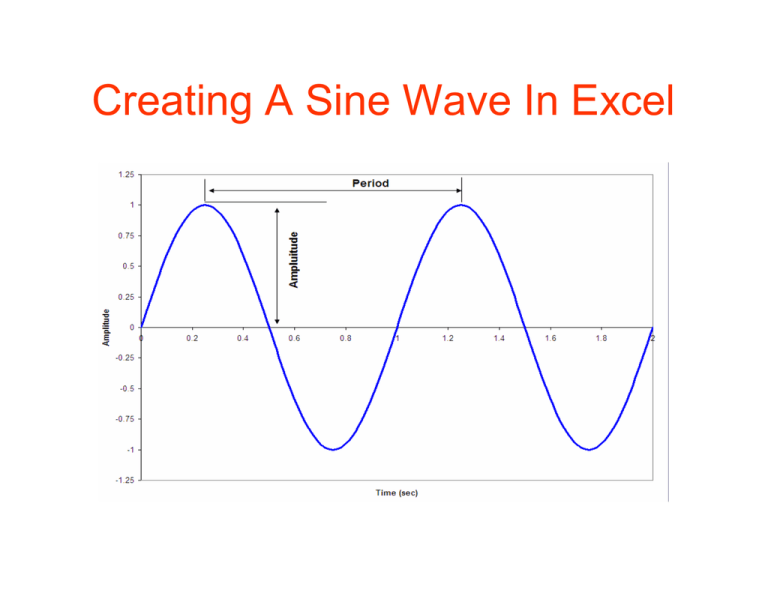
Creating A Sine Wave In Excel Step 1. Create Columns in Excel for: Frequency, Circular Frequency, Omega (rad/s), Amplitude, Delta t, Time, and Sine Wave. Step 2. Enter Desired Values for Frequency, Omega, Amplitude, and Delta t (sec.) Step 3. Fill in Columns for Time (sec.) A. Enter in the initial time (in this example 0.0 sec.) in the first cell in the time column. B. Fill in the time column using Equation 1. ti+1 = ti+ Δt (Equation 1) Note: you need to fix the cell for delta t in Equation 1. This can be done by adding a $ in front of the Row and Column values or by pressing ‘F4’. C. Highlight the desired number of rows in the time column and fill down (Ctrl +D). Step 4: Generating a Sine Wave Recall: The sine wave or sinusoid in its most basic form is: y(t) = A *sin(ωt+θ) (Equation 2) Where: • A = Amplitude • ω=Angular frequency/ Circular frequency=2πf (rad/s) • f=1/T, where T=Period in seconds • θ=phase • t=time (s) Step 4: Generating a Sine Wave (Cont.) For this example: Generate a 1Hz Sine Wave, with ω=2π and Amplitude 1. f = 1 Hz, ω = 2π, therefore, T=1 sec. Step 4: Generating a Sine Wave (Cont.) A. Enter the sine wave equation in the first cell of the sine wave column. B. This can be done by entering, =1*SIN($B$2*$E2); Notice: ω column will be fixed using the $ notation in front of the row and column and the time column changes. Step 4: Generating a Sine Wave (Cont.) C. Highlight the desired number of rows in the time column and fill down (Ctrl +D). Step 4: Generating a Sine Wave (Cont.) D. Sine Wave column after “Filling Down” Step 4: Generating a Sine Wave (Cont.) E. Plot the time vs. your sine wave column, by going to chart wizard and selecting the XY scatter chart type. Step 4: Generating a Sine Wave (Cont.) F. Enter your data. Select the Series Tab, and select your x values as your time column and y values as your sine wave column. Step 4: G. Results Generating a Sine Wave (Cont.)


