Influence of Injection Moulding Parameters on Tensile Strength of
advertisement

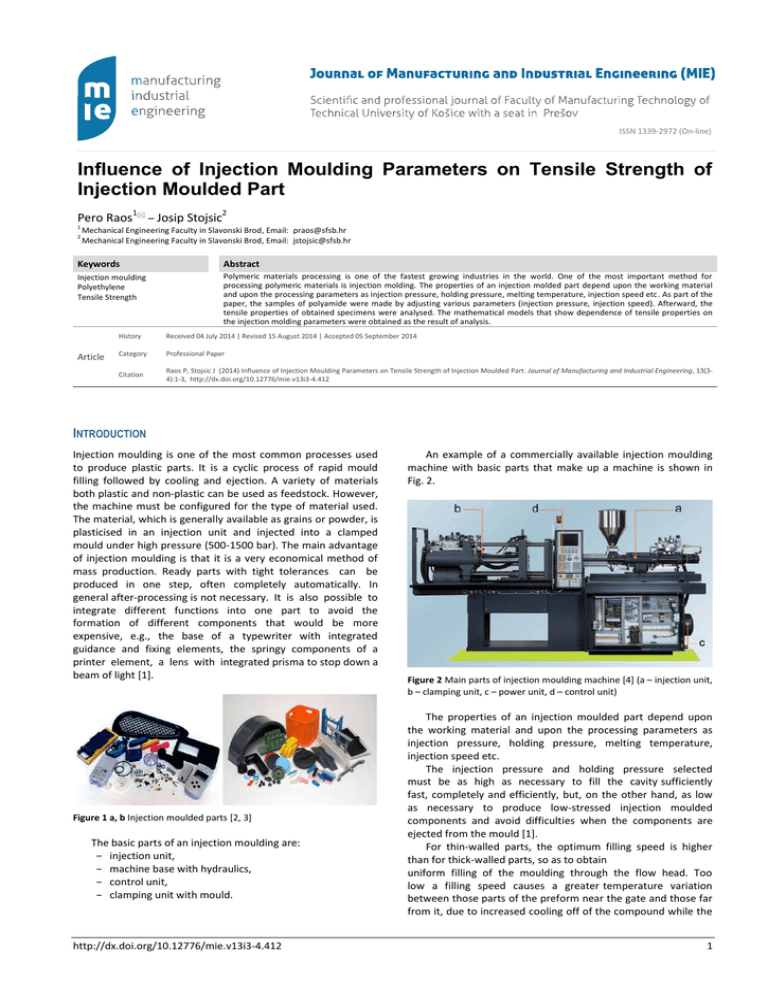
Influence of Injection Moulding Parameters on Tensile Strength of Injection Moulded Part Raos, P, Stojcis J ISSN 1339-2972 (On-line) Influence of Injection Moulding Parameters on Tensile Strength of Injection Moulded Part Pero Raos1 – Josip Stojsic2 1 2 Mechanical Engineering Faculty in Slavonski Brod, Email: praos@sfsb.hr Mechanical Engineering Faculty in Slavonski Brod, Email: jstojsic@sfsb.hr Keywords Abstract Injection moulding Polyethylene Tensile Strength Polymeric materials processing is one of the fastest growing industries in the world. One of the most important method for processing polymeric materials is injection molding. The properties of an injection molded part depend upon the working material and upon the processing parameters as injection pressure, holding pressure, melting temperature, injection speed etc. As part of the paper, the samples of polyamide were made by adjusting various parameters (injection pressure, injection speed). Afterward, the tensile properties of obtained specimens were analysed. The mathematical models that show dependence of tensile properties on the injection molding parameters were obtained as the result of analysis. Article History Received 04 July 2014 | Revised 15 August 2014 | Accepted 05 September 2014 Category Professional Paper Citation Raos P, Stojsic J (2014) Influence of Injection Moulding Parameters on Tensile Strength of Injection Moulded Part. Journal of Manufacturing and Industrial Engineering, 13(34):1-3, http://dx.doi.org/10.12776/mie.v13i3-4.412 INTRODUCTION Injection moulding is one of the most common processes used to produce plastic parts. It is a cyclic process of rapid mould filling followed by cooling and ejection. A variety of materials both plastic and non-plastic can be used as feedstock. However, the machine must be configured for the type of material used. The material, which is generally available as grains or powder, is plasticised in an injection unit and injected into a clamped mould under high pressure (500-1500 bar). The main advantage of injection moulding is that it is a very economical method of mass production. Ready parts with tight tolerances can be produced in one step, often completely automatically. In general after-processing is not necessary. It is also possible to integrate different functions into one part to avoid the formation of different components that would be more expensive, e.g., the base of a typewriter with integrated guidance and fixing elements, the springy components of a printer element, a lens with integrated prisma to stop down a beam of light [1]. Figure 1 a, b Injection moulded parts [2, 3] The basic parts of an injection moulding are: − injection unit, − machine base with hydraulics, − control unit, − clamping unit with mould. http://dx.doi.org/10.12776/mie.v13i3-4.412 An example of a commercially available injection moulding machine with basic parts that make up a machine is shown in Fig. 2. Figure 2 Main parts of injection moulding machine [4] (a – injection unit, b – clamping unit, c – power unit, d – control unit) The properties of an injection moulded part depend upon the working material and upon the processing parameters as injection pressure, holding pressure, melting temperature, injection speed etc. The injection pressure and holding pressure selected must be as high as necessary to fill the cavity sufficiently fast, completely and efficiently, but, on the other hand, as low as necessary to produce low-stressed injection moulded components and avoid difficulties when the components are ejected from the mould [1]. For thin-walled parts, the optimum filling speed is higher than for thick-walled parts, so as to obtain uniform filling of the moulding through the flow head. Too low a filling speed causes a greater temperature variation between those parts of the preform near the gate and those far from it, due to increased cooling off of the compound while the 1 Raos, P, Stojcis J Influence of Injection Moulding Parameters on Tensile Strength of Injection Moulded Part cavity is being filled. The higher viscosity of the colder compounds also requires higher injection pressures, which in turn require stronger locking pressures [1]. The aim of this paper is determine influence of two processing parameters (injection pressure and injection speed on tensile strength of injection moulded part. EXPERIMENTS Injection moulding machine: Testing samples were prepared on Dr. Boy injection moulding machine shown on Fig. 3, with technical data shown in Table 1. Table 1 Technical data BOY XS injection moulding machine [5] Hydraulic power unit Clamping force Distance between tie bars Min. stroke volume Max. stroke volume Max. injection pressure Screw diameter Max. injection speed 10 kN 160 mm (horizontal) x 205 mm (diagonal) 3 0.1 cm 3 8.0 cm 3128 bar 12 mm 3 -1 24 cm .s Table 3 Conventional sequence in the central-composite design of experiment (real values of factor levels) No. of sample 1 2 3 4 6 7 8 9 10 11 12 Run No. 9 2 7 5 10 6 1 11 4 12 3 Injection pressure [bar] 600 700 600 600 700 741 500 600 500 459 600 Injection speed 3 [cm /s] 8 10 15 15 20 15 20 15 10 15 22 Figure 4 a, b Testing of samples RESULTS AND DISCUSION Figure 3 “BOY XS” injection moulding machine Studied material: Material used for the test samples is polyethylene known under the trade name MG9621B produced by „BOREALIS. The main material properties are given in Table 2. m Table 2 Properties of MG9612B [6] Density Melting flow rate (190 °C/2.16 kg) Tensile strength (50 mm/min) Melting temperature Shrinkage 962 kg/m3 12 g/10 min 26 MPa 200 – 260 °C 1 – 2 % (depending on sample thickness and processing parameters) Injection moulding of testing samples: Table 3 shows the conventional sequence in the central-composite design of experiment with the real values of factors and the sequence of conducting the experiment. Injection pressure is in the range from 459 to 741 bar and injection speed range is from 8 to 22 3 cm /s. The shape of test sample is 5B according to the Standard HRN EN ISO 527-1: 2012. Testing of sample: Universal tensile testing machine (Fig. 4 a, b) was used for testing of tensile properties. Five test samples for each state of experiment were used for testing (60 samples). The testing speed was 5 mm/min. 2 In Table 4 are shown mean values of response (max. force). Mean value is calculated for five repeated measurement. After testing of sample and calculated mean force for each state of experiment tensile strength was calculated. The tensile strength is calculated by the following equation: F A [MPa] (1) where is F – force in N and A – cross-section of test sample 2 2 in mm . Cross-section of test samples are 12 mm . Table 4 Conventional sequence in the central-composite design of experiment (real values of factor levels) No. of sample Force [N] 1 169.8 2 163.4 3 169.8 4 171.6 6 165.2 7 159.8 8 180.8 9 167.6 10 179.8 11 187 12 167.2 Tensile strength [MPa] 14.15 13.616 14.15 14.3 13.76 13.316 15.06 13.96 14.983 15.583 13.93 http://dx.doi.org/10.12776/mie.v13i3-4.412 Factor Coding: Actual Tensile strength (MPa) Design points above predicted value Design points below predicted value 15.583 Analysing the obtained data (Table 4) it was determined the 13.316 minimum value of tensile strength is 13.31 MPa and 15.58 MPa X1 = A: Injection pressure X2 = B: Injection speed is maximum. Mean value of response is 14.239 MPa, standard deviation (amount of variation or dispersion from the mean value) is 0.656. Regression model and analysis of variance of the model: Table 5 presents the report for the analysis of variance of the selected linear regression model, which shows the dependence of tensile strength polyethylene sample on the input variables. Model A – injection pressure [bar] B – injection 3 speed [cm /s] Residual Lack of fit Pure error Cor total Sum of Squares 4.31 4.31 0.0015 0.42 0.35 0.062 4.73 df 2 1 1 9 6 3 11 F value 46.68 93.33 p value < 0,0001 < 0,0001 0.01015 0.022 0.8854 2.83 0.2113 Member of model A is significant in the model (p value – probability for F variables that is 93.33 is less than 0.05). Member of model B, is not significant (p value for F variable that is 0.022 is greater than 0.05). Due to statistically insignificant factors, a reduced model was made. A method of backward elimination, which is based on the sequential testing of the significance of input variables using the F-test, was chosen for the reduced model. Table 6 ANOVA for response surface of reduced linear model – tensile strength Source Model A – injection pressure [bar] Residual Lack of fit Pure error Cor total Sum of Squares 4.31 4.31 0.42 0.35 0.062 4.73 df 1 1 10 7 3 11 Mean Square 4.31 4.31 F value 103.45 103.45 p value < 0,0001 < 0,0001 0.042 0.051 0.021 2.43 0.2500 14 13.5 13 10 12 741 684 628 571 515 458 Injection pressure, bar Figure 5 3D surface view of reduced linear model – tensile strength CONCLUSION AND FUTURE DIRECTION OF RESEARCH Injection moulding is one of the most common cyclic processes used to produce plastic parts. Today more than onethird of all polymeric materials are injection moulded. Parameters of injection moulding as melting temperature, mould temperature, clamping force, injection pressure, injection speed etc., significantly affect the properties of moulded parts. In this paper the impact of two parameters (injection pressure and injection speed) on tensile strength of polyethylene injection moulded part was determined. The analysis of variance showed that the injection pressure has the significant influence on the tensile strength, while the injection speed has no effect on the observed property at the significance level α = 0.05. The regression analysis revealed the expressions that show the function dependence of injection pressure on tensile strength of polyethylene injection moulded part. Further research will go in the direction of getting appropriate mathematical model that will determine the dependence of mechanical properties on other processing parameters of injection moulding. REFERENCES [1] [2] [3] Member of model A is significant in the model (p value – probability for F variables that is 103.45 is less than 0.05). The lack of fit is here with the probability of F variable 0.2500. This probability is greater than 0.05 and the null hypothesis that the deviation from the model is not significant, i.e. that the model estimates the reality well, is accepted. The coefficient of 2 determination R is the portion of explained variability (how much the regression y deviates from the mean) in the total variability (how much the real y deviates from the mean), and is 0.91. Expression 2 illustrates the reduced regression model with the real values of factors. 18 20 [4] tensile strength=18.64 – 0.074 x injection pressure 15 14.5 Injection speed, cm3/s 16 Mean Square 2.16 4.31 0.046 0.059 0.021 20 16 15.5 14 Table 5 ANOVA for response surface – tensile strength Source Raos, P, Stojcis J T e n s ile s t r e n g t h , M P a Design-Expert® Software Influence of Injection Moulding Parameters on Tensile Strength of Injection Moulded Part [5] [6] Goodship V (1994) Pratical Guide to injection Moulding, Rapra Technology, Shawbury, United Kingdom. Mold Rite, Inc., Woodinville: Home, available on: http://www.moldriteinc.com/. CNMoulding, Shanghai: Home, available on: http://www.plastic-injectionmoulding.com/. Šercer M (2004) Smjerovi razvoja ubrizgavalica za injekcijsko prešanje plastomera. Polymeri, 24:74-78. Dr. Boy GmbH & Co. Kg: Products, available on: http://drboy.de/de/product/boy-xs/. Nomis d.o.o. Granulati, available on: http://www.nomis.hr/admin/_upload/_files/MG9621.pdf. LIST OF USED SYMBOLS ANOVA – ANalysis Of VAriance (2) The graphic representation of reduced model is shown in Fig 5. http://dx.doi.org/10.12776/mie.v13i3-4.412 3


