Experiment 9 Conservation of Energy Mass and Spring System
advertisement

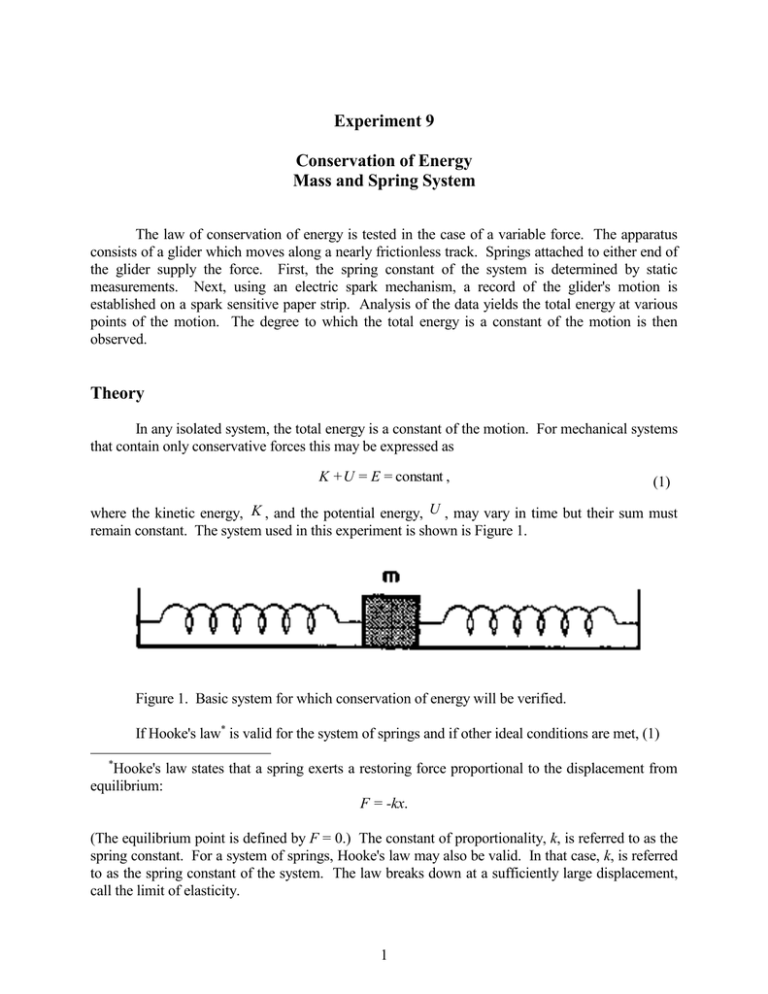
Experiment 9 Conservation of Energy Mass and Spring System The law of conservation of energy is tested in the case of a variable force. The apparatus consists of a glider which moves along a nearly frictionless track. Springs attached to either end of the glider supply the force. First, the spring constant of the system is determined by static measurements. Next, using an electric spark mechanism, a record of the glider's motion is established on a spark sensitive paper strip. Analysis of the data yields the total energy at various points of the motion. The degree to which the total energy is a constant of the motion is then observed. Theory In any isolated system, the total energy is a constant of the motion. For mechanical systems that contain only conservative forces this may be expressed as K + U = E = constant , (1) where the kinetic energy, K , and the potential energy, U , may vary in time but their sum must remain constant. The system used in this experiment is shown is Figure 1. Figure 1. Basic system for which conservation of energy will be verified. If Hooke's law* is valid for the system of springs and if other ideal conditions are met, (1) * Hooke's law states that a spring exerts a restoring force proportional to the displacement from equilibrium: F = -kx. (The equilibrium point is defined by F = 0.) The constant of proportionality, k, is referred to as the spring constant. For a system of springs, Hooke's law may also be valid. In that case, k, is referred to as the spring constant of the system. The law breaks down at a sufficiently large displacement, call the limit of elasticity. 1 1 2 m v 2 + 12 k x 2 = E , (2) and E = constant , (3) where m = mass of the glider, k = spring constant of the system, x = displacement of the glider from equilibrium, and v = instantaneous velocity of the glider at the displacement x . In the experiment, the glider will be released from rest ( v = 0) at some known initial displacement, x o . Equations (2) and (3) then imply that E = E o = 12 k xo2 = constant . (4) The system's total energy at various displacements will be measured according to (2) and will be compared to the constant value determined in (4). Apparatus o o o o air track with air supply and sparker springs o pulleys, weights, string double pan balance o meter stick spark sensitive paper strip o masking tape Procedure, Part I: Determination of the Spring Constant 1) Turn on the air pump and allow the glider to come to equilibrium. Record the reading, xeq, at which the one end of the glider lies on the scale. 2) Attach the string to the glider. Pass the string over the pulley and attach the weight hanger to the end of the string. Record the mass, M, of the weight hanger and the position of the glider on the scale, x. 3) Continue to add mass to the weight hanger and record both the total mass, M, and the scale position of the glider, x. 4) Turn off the air pump. 2 Analysis, Part I Graph the values of the weight hanging from the string, Mg, on the ordinate and the scale position, x, on the abscissa. Draw the best straight line through the points, and find the slope of this line. The slope then gives the value of the spring constant, k. Procedure, Part II: Determination of the Kinetic, Potential, and Total Energies 1) Record the mass, m 1, of the glider. Record the time setting, t 2, of the sparker. 2) Use masking tape to attach a one meter length of spark tape to the center portion of the yellow-colored mounting strip of the air track. 3) Turn on the air pump and allow the glider to come to equilibrium. Turn on and engage the sparker for several seconds. This marks the x = 0 3 position. 4) Displace the glider to the maximum displacement position marked on the air track and place your finger in front of the glider to prevent it from moving. Engage the sparker and release the glider. When the glider reaches its furthest extent, disengage the sparker. (Be sure that the sparker is not engaged when the glider reverses its motion.) 5) Turn off the sparker and the air pump. Carefully remove the spark paper. 6) Tape the strip to a flat surface and circle the dots, including the initial one. The equilibrium point should not be circled. Number the dots, beginning with zero for the initial dot. 7) Using the meter stick on its edge, measure the displacement of each dot from the equilibrium line. In one direction, the measurements are positive and in the opposite direction they are negative. Analysis, Part II Using (4) and the values of the initial displacement, x o 4, and the spring constant, k 5, determine the initial energy, Eo 6, of the system. Express its value in joules. 3 The instantaneous speed, v ( x ) 7, at the displacement x 8 can be found approximately by dividing the distance between alternate dots by the elapsed time and associating the value with the displacement at the time midpoint: v ( xi ) = xi+1 - xi -1 , for i = 2 , 3, 4 ,..., N- 1 , 2t where N 9 is the number of the final dot. As in the free-fall experiment, the initial interval (between x o 10 and x 2 11) cannot be used to determine a velocity. However, the instantaneous velocity at the initial displacement is known exactly: v ( xo ) = 0 12. Construct a data table containing the spark numbers, displacements from the equilibrium line, changes in displacement, and speeds. Be sure that the speeds are correctly associated with their displacements. Include the kinetic, potential, and total energies: K = 12 m v 2 , U = 12 k x 2 , E = K + U . The suggested form of the data table is given in Figure 2. dot number x 13 0 xo 1 x1 2 x2 3 x3 v 15 K 16 U 17 E 18 0 0 Eo Eo x3-x1 v2 K2 U2 K2+U2 x4-x2 v3 K3 U3 K3+U3 x 14 (etc.) Figure 2. Suggested form of the data table. On a single graph, plot K, U, and E as functions of x. Include the xo data. Draw smooth curves through or near the points and indicate with arrows the direction of motion in which the glider moved. Graph the constant value Eo over the interval of motion. The E and U curves should both begin at the point (xo, Eo). The K curve should begin at the point (xo, 0). Note that the U curve is necessarily a parabola. It should therefore be very smooth and pass through every data point. Also note that it should pass through the origin: (x, U) = (0, 0). 4 Conclusion Indicate the major sources of error in the experiment, and explain how the experimental values of total energy are affected by the sources of error. Explain whether or not the graph reflects the presence of the sources of error. Questions 1) What conditions must be met in order for (2) and (3) to be valid? Be specific and complete. 2) Regardless of the experimental accuracy of this ratio, v(x) determined in this manner is approximate. Why? (Hint: Under what conditions does the average velocity over an interval equal the instantaneous velocity at the time midpoint of the interval? Is this condition met here?) 5


