Document 18001412
advertisement

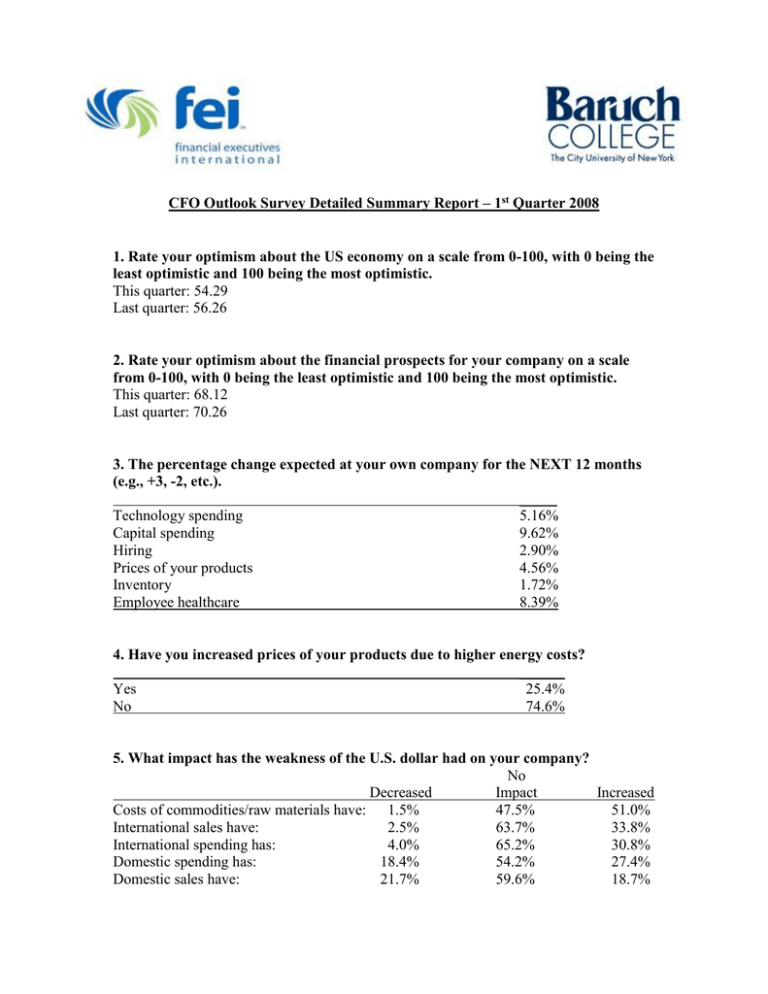
CFO Outlook Survey Detailed Summary Report – 1st Quarter 2008 1. Rate your optimism about the US economy on a scale from 0-100, with 0 being the least optimistic and 100 being the most optimistic. This quarter: 54.29 Last quarter: 56.26 2. Rate your optimism about the financial prospects for your company on a scale from 0-100, with 0 being the least optimistic and 100 being the most optimistic. This quarter: 68.12 Last quarter: 70.26 3. The percentage change expected at your own company for the NEXT 12 months (e.g., +3, -2, etc.). _____ Technology spending 5.16% Capital spending 9.62% Hiring 2.90% Prices of your products 4.56% Inventory 1.72% Employee healthcare 8.39% 4. Have you increased prices of your products due to higher energy costs? ______ Yes 25.4% No 74.6% 5. What impact has the weakness of the U.S. dollar had on your company? No Decreased Impact Increased Costs of commodities/raw materials have: 1.5% 47.5% 51.0% International sales have: 2.5% 63.7% 33.8% International spending has: 4.0% 65.2% 30.8% Domestic spending has: 18.4% 54.2% 27.4% Domestic sales have: 21.7% 59.6% 18.7% Quarterly earnings have: Other impact: 32.8% 8.8% 41.8% 79.4% 25.4% 11.8% 6. What is your view of the potential for recession in the U.S. in 2008? The U.S.: Is currently in a recession: Will likely go into a recession in the next 3 months: Will likely go into a recession in the next 6 months: Will likely go into a recession in the next 9 months: Will likely go into a recession in the next 12 months: Will not go into a recession in 2008: Don't know: 40.5 % 20.0 % 11.7 % 2.0 % 2.0 % 17.6 % 6.3 % 7. During the 1st quarter, did you delay implementation of any business-related spending due to concerns of a recession? Yes: No: 33.8 % 66.2 % 8. Do you plan to increase equipment purchases to maximize the advantages of the business tax incentive in the economic stimulus bill that was recently passed which allows businesses accelerated depreciation tax breaks on equipment purchased and placed into service in 2008? Yes No Don't know Ineligible 12.3 % 66.0 % 15.3 % 6.4 % 9. How has your 2008 marketing / advertising budget been affected by the current economic downturn? Decreased budget Increased budget Not affected, budget is same as 2007 13.9 % 22.9 % 63.2 % 9b. Have you redirected dollars towards new media? Yes No 13.8 % 86.2 % 10. Given the current economic downturn, what areas has your company identified for cutbacks? Hiring (decrease, or freeze) We are not planning any cutbacks at this time Conduct layoffs IT/ technology Benefits (increase employee contribution Decrease executive perks Marketing/advertising Other 45.9 % 33.5 % 23.9 % 18.7 % 18.7 % 16.7 % 14.8 % 7.7 % 11. Have limits on the H1B work permit visa created a problem filling skilled labor positions at your company? Yes No Don't know 13.3 % 76.4 % 10.3 % PUBLIC COMPANIES ONLY What is your perception of the ratings agency process? The agencies should create a new rating scale The agencies should continue using the same rating process The agencies should add warning labels Other (Please define) 35.4 % 30.8 % 18.5 % 15.4 % If the ratings agencies change their process to include warnings and provide better distinctions for structured finance ratings, will you? Have the same opinion of their ratings Have more confidence in their ratings Have less confidence in their ratings Other (Please define) 49.2 % 46.2 % 3.1 % 1.5 % COMPANY DEMOGRAPHICS Industry Manufacturing Retail/Wholesale Banking/Finance/Insurance Other Service/Consulting Healthcare/Pharmaceutical Tech [Software/Biotech] Transportation/Energy Mining/Construction Communications/Media 27.1 % 14.3 % 10.3 % 9.9 % 9.4 % 8.4 % 8.4 % 4.9 % 4.4 % 3.0 % Sales Revenue Less than $25 million $25-$99 million $100-$499 million $500-$999 million $1-$4.9 billion Over $5 billion 17.8 % 25.7 % 29.2 % 7.4 % 15.3 % .5 % Number of Employees Fewer than 100 100-499 500-999 1,000-2,499 2,500-4,999 5,000-9,999 Over 10,000 17.8 % 29.7 % 16.2 % 15.1 % 5.9 % 6.5 % 8.6 % Headquarters Midwest Pacific South Central Northeast South Atlantic Mountain Outside U.S. 27.7 % 22.3 % 17.8 % 16.8 % 9.9 % 4.5 % 1.0 % Ownership Private Public, NYSE Public, Nasdaq/AMEX 66.8 % 16.6 % 16.6 % Foreign Sales 0% 1-24% 25-50% Over 50% 37.3 % 43.6 % 10.8 % 8.3 %


