Lab Report Grading Sheet
advertisement
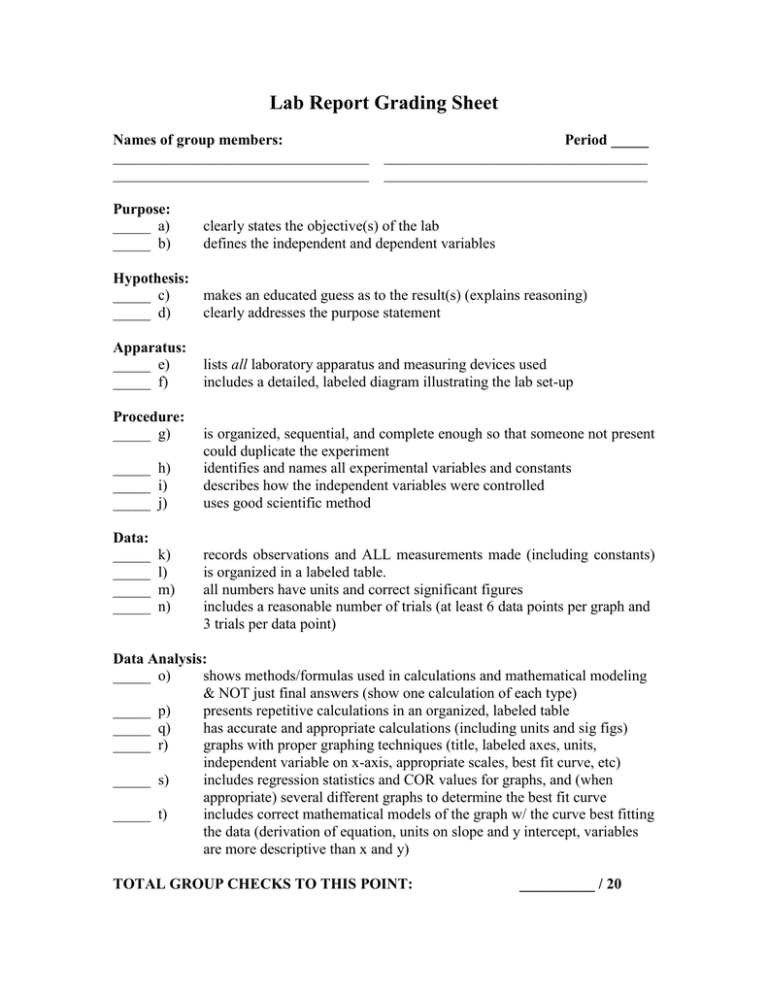
Lab Report Grading Sheet Names of group members: __________________________________ __________________________________ Purpose: _____ a) _____ b) Period _____ ___________________________________ ___________________________________ clearly states the objective(s) of the lab defines the independent and dependent variables Hypothesis: _____ c) makes an educated guess as to the result(s) (explains reasoning) _____ d) clearly addresses the purpose statement Apparatus: _____ e) _____ f) Procedure: _____ g) _____ h) _____ i) _____ j) Data: _____ _____ _____ _____ k) l) m) n) lists all laboratory apparatus and measuring devices used includes a detailed, labeled diagram illustrating the lab set-up is organized, sequential, and complete enough so that someone not present could duplicate the experiment identifies and names all experimental variables and constants describes how the independent variables were controlled uses good scientific method records observations and ALL measurements made (including constants) is organized in a labeled table. all numbers have units and correct significant figures includes a reasonable number of trials (at least 6 data points per graph and 3 trials per data point) Data Analysis: _____ o) shows methods/formulas used in calculations and mathematical modeling & NOT just final answers (show one calculation of each type) _____ p) presents repetitive calculations in an organized, labeled table _____ q) has accurate and appropriate calculations (including units and sig figs) _____ r) graphs with proper graphing techniques (title, labeled axes, units, independent variable on x-axis, appropriate scales, best fit curve, etc) _____ s) includes regression statistics and COR values for graphs, and (when appropriate) several different graphs to determine the best fit curve _____ t) includes correct mathematical models of the graph w/ the curve best fitting the data (derivation of equation, units on slope and y intercept, variables are more descriptive than x and y) TOTAL GROUP CHECKS TO THIS POINT: __________ / 20 Name of group member: _______________________________________________ Conclusion (to be done individually by each person in the group – identical or plagiarized conclusions will result in a zero for this section) _____ u) _____ v) _____ w) _____ x) _____ y) _____ z) relates to the purpose and is accurate as possible based upon the data available. states the relationship identified in a clear, concise English sentence. includes the mathematical model (equation) which most accurately represents your data, discussing the physical meaning of the slope and yintercept (don’t forget the 5% rule) (even if there is no mathematical relationship, the conclusion must still be backed up with info from the data and data analysis sections) gives an explanation for results that differ from what is expected (both from your hypothesis and research you have done) discusses specific areas of experimental error and how that affected results discusses how experiment could be improved if performed again (GROUP CHECKS +INDIVIDUAL CHECKS)/26 x 100 = # GRADE ( ______ + ______ ) / 26 = ______
