Name______________________________________ Date_______________ Period_________
advertisement
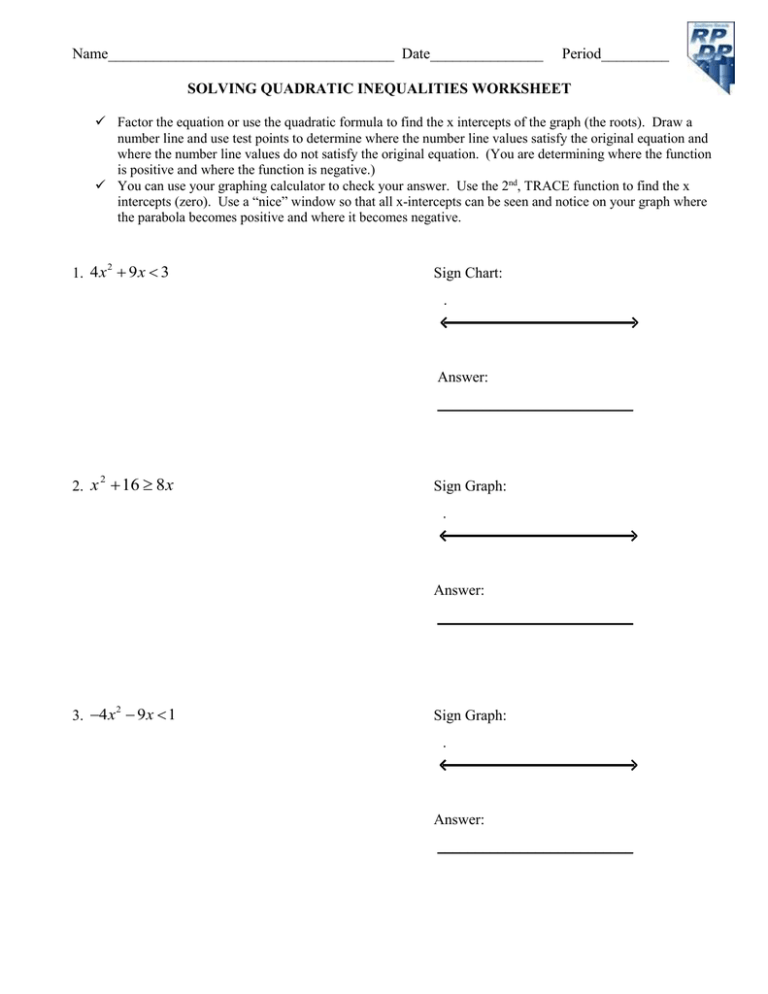
Name______________________________________ Date_______________ Period_________ SOLVING QUADRATIC INEQUALITIES WORKSHEET Factor the equation or use the quadratic formula to find the x intercepts of the graph (the roots). Draw a number line and use test points to determine where the number line values satisfy the original equation and where the number line values do not satisfy the original equation. (You are determining where the function is positive and where the function is negative.) You can use your graphing calculator to check your answer. Use the 2nd, TRACE function to find the x intercepts (zero). Use a “nice” window so that all x-intercepts can be seen and notice on your graph where the parabola becomes positive and where it becomes negative. 2 1. 4 x 9 x 3 Sign Chart: Answer: __________________________ 2. x 16 8 x 2 Sign Graph: Answer: __________________________ 2 3. 4 x 9 x 1 Sign Graph: Answer: __________________________ 2 4. x 3x 6 0 Sign Graph: Answer: __________________________ Problem Solving: 5. The profit a coat manufacturer makes each day is modeled by the equation P x 120 x 2000 , where P is the profit and x is the price for each coat sold. For what values of x does the company make a profit? 2 6. When a baseball is hit by a batter, the height of the ball, H, at time t, (t 0), is determined by the equation H 16t equal to 52 feet? 2 64t 4 . For which interval of time is the height of the ball greater than or 7. A rectangle is 6 cm longer than it is wide. Find the possible dimensions if the area of the rectangle is more than 216 square centimeters.
