One-Dimensional Kinematics Position, Velocity, Acceleration
advertisement

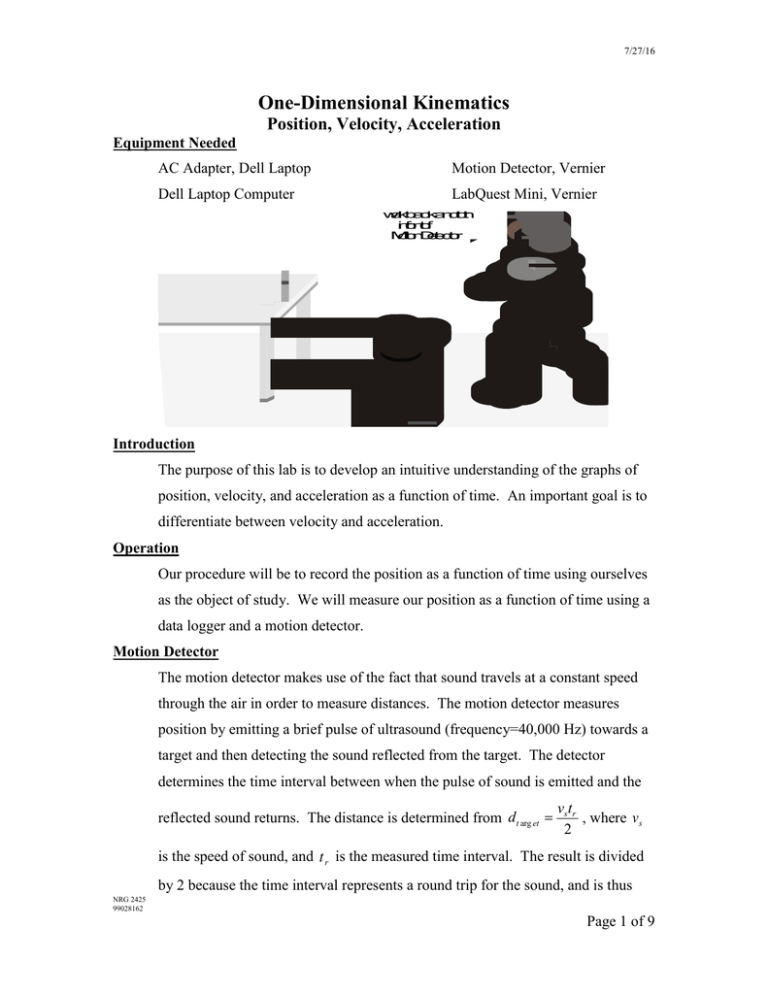
7/27/16 One-Dimensional Kinematics Position, Velocity, Acceleration Equipment Needed AC Adapter, Dell Laptop Motion Detector, Vernier Dell Laptop Computer LabQuest Mini, Vernier w alkbackandf or h t inf r ono tf M ot ionD et ect or Introduction The purpose of this lab is to develop an intuitive understanding of the graphs of position, velocity, and acceleration as a function of time. An important goal is to differentiate between velocity and acceleration. Operation Our procedure will be to record the position as a function of time using ourselves as the object of study. We will measure our position as a function of time using a data logger and a motion detector. Motion Detector The motion detector makes use of the fact that sound travels at a constant speed through the air in order to measure distances. The motion detector measures position by emitting a brief pulse of ultrasound (frequency=40,000 Hz) towards a target and then detecting the sound reflected from the target. The detector determines the time interval between when the pulse of sound is emitted and the reflected sound returns. The distance is determined from dt arg et vs t r , where v s 2 is the speed of sound, and t r is the measured time interval. The result is divided by 2 because the time interval represents a round trip for the sound, and is thus NRG 2425 99028162 Page 1 of 9 7/27/16 double the distance to the target. The speed of sound is affected by temperature. At room temperature, the speed is approximately 343 m/s, and this is the value used by the motion detector in determining distances. Procedure 1. Set-up To set up the apparatus, plug the cable from the motion detector into the socket labeled DIG 1 on the Vernier LabQuest Mini interface. Verify that the interface is plugged into the computer and that it has power. Position or clamp the motion detector to the lab table or a chair so that it has an unobstructed view of you walking towards and away from it. Note: This motion detector has a practical measurement range from 0.15 meters to 6 meters. 2. Starting the Software Double click LoggerPro 3.x. On the menu: Click File. Click Open. The address is Experiments/Probes & Sensors/Motion Detector/Motion Detector.cmbl. 3. Test the Set-up To verify that the apparatus is running correctly, hit the ‘Collect’ button. There are three graphs on the screen. Wave your hand in front of the motion detector. You should see deflection on all three graphs. If not contact your instructor or the lab tech. 4. Printing To print your graphs, click the ‘Printer’ button on the tool bar. Follow the instructions. NRG 2425 99028162 Page 2 of 9 7/27/16 Report Worksheet Now that we have got our apparatus working, we will acquire the following pictures. Follow the instructions in the order listed. I. a. First, describe in your words how you would move so that the position increases linearly with time. Be specific. b. Sketch a graph of your prediction of what the graph of the velocity vs. time should look like for this picture. c. Sketch a graph of your prediction of what the graph of Acceleration vs. time should look like for this picture. d. Collect data of a person in your group moving in the described manner. e. Look at the graphs on the computer, and discuss their appearance compared to your prediction. (A sentence or so for each graph will suffice.) Note that the acceleration graph may appear very erratic. Why? NRG 2425 99028162 Page 3 of 9 7/27/16 Attach a print of the three graphs per group consisting of position vs. time, velocity vs. time, and acceleration vs. time. II. a. Describe in your own words how you would move so that the position decreases linearly with time. Be specific. b. Sketch a graph of your prediction of what the graph of the velocity vs. time should look like for this picture. c. Sketch a graph of your prediction of what acceleration vs. time should look like for this picture. d. Collect data of a person in your group moving in the described manner. e. Look at the graphs on the computer, and discuss their appearance compared to your prediction. (A sentence or so for each graph will suffice.) NRG 2425 99028162 Page 4 of 9 7/27/16 Attach one print of the three graphs per group consisting of position vs. time, velocity vs. time, and acceleration vs. time. III. a. Describe in your own words how you would move so that the position increases with time and the graph is concave up. Be specific. b. Sketch a graph of your prediction of what the graph of the velocity vs. time should look like for this picture. c. Sketch a graph of your prediction of what the graph of acceleration vs. time should look like for this picture. d. Collect data of a person in your group moving the described manner. e. Look at the graphs on the computer, and discuss their appearance compared to your prediction. (A sentence or so for each graph will suffice.) NRG 2425 99028162 Page 5 of 9 7/27/16 Attach one print of the three graphs per group consisting of position vs. time, velocity vs. time, and acceleration vs. time. IV. a. Describe in the provided space how you would move so that the position increases with time and the graph is concave down. Be specific. b. Sketch a graph of your prediction of what the graph of acceleration vs. time should look like for this picture. c. Sketch a graph of your prediction of what the graph of the velocity vs. time should look like for this picture. d. Collect data of a person in your group moving in the described manner. e. Look at the graphs on the computer, and discuss their appearance compared to your prediction. (A sentence or so for each graph will suffice.) NRG 2425 99028162 Page 6 of 9 7/27/16 Attach one print of the three graphs per group consisting of position vs. time, velocity vs. time, and acceleration vs. time. V. Each person in your group should collect data and print out a graph where the position varies approximately sinusoidally in time. a. How do you have to move in order to obtain such a graph? On the graph mark the following. b. Each interval where the velocity is positive. c. Each interval where the velocity is negative. d. Each interval where the acceleration is positive. e. Each interval where the acceleration is negative. Attach the graph for each person to the report. VI. Sketch by hand in the space below graphs of position versus time for the following types of motions. a. The velocity and acceleration are both zero. b. The velocity is initially positive and the acceleration is negative. c. The velocity is initially negative and the acceleration is positive. d. The velocity is initially zero, but the acceleration is positive. NRG 2425 99028162 Page 7 of 9 7/27/16 VII. a. Describe how to construct a graph of position versus time which will at first have a constant negative velocity of –1 m/s and then will smoothly change until it has a constant positive velocity of 1 m/s. b. Predict what the acceleration vs. time graph will look like. c. Carry out such a motion, and print the graph. d. On the graph indicate the intervals where the acceleration is positive. e. On the graph indicate the intervals where the speed is increasing and decreasing. f. Explain why even though the acceleration is positive, over a certain interval, the speed decreases over part of the interval and increases over part of the interval. VIII. Go to the FILE menu and click ‘Open’ File again. The Motion Detector File should already be open. Double click on the file called Position Match 1.cmbl. The computer will display a graph of distance versus time NRG 2425 99028162 Page 8 of 9 7/27/16 with an outline . When you hit the collect button, the graph of your motion will be shown on the same graph. Have each person in the group try to match the graph as well as possible. Print and attach your best result. IX. In the same folder open the file called Velocity Match.cmbl. It will show a graph of velocity versus time. When you click on the collect button, your velocity will be shown on the same graph. Have each person in your group try to match the graph. (This one is tricky.) Print and attach your best result. X. Write a story describing the motion (including direction) of a car that has a velocity versus time graph that looks like the following. NRG 2425 99028162 Page 9 of 9


