Newton’s 2 Law Horizontal
advertisement
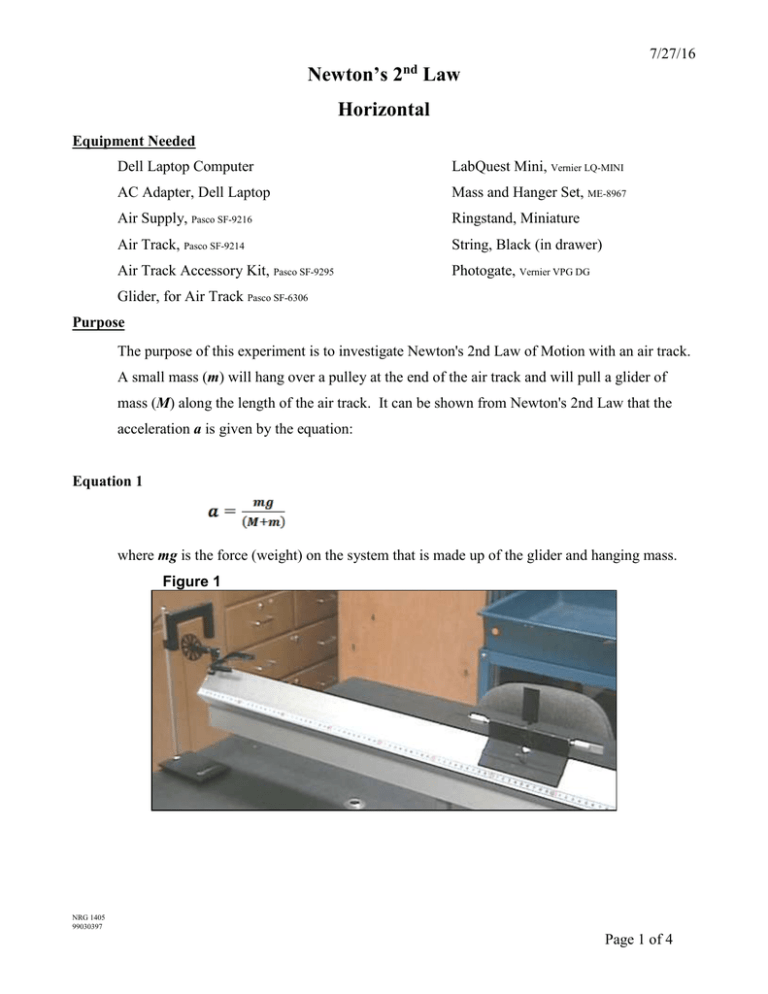
7/27/16 Newton’s 2 Law nd Horizontal Equipment Needed Dell Laptop Computer LabQuest Mini, Vernier LQ-MINI AC Adapter, Dell Laptop Mass and Hanger Set, ME-8967 Air Supply, Pasco SF-9216 Ringstand, Miniature Air Track, Pasco SF-9214 String, Black (in drawer) Air Track Accessory Kit, Pasco SF-9295 Photogate, Vernier VPG DG Glider, for Air Track Pasco SF-6306 Purpose The purpose of this experiment is to investigate Newton's 2nd Law of Motion with an air track. A small mass (m) will hang over a pulley at the end of the air track and will pull a glider of mass (M) along the length of the air track. It can be shown from Newton's 2nd Law that the acceleration a is given by the equation: Equation 1 where mg is the force (weight) on the system that is made up of the glider and hanging mass. Figure 1 NRG 1405 99030397 Page 1 of 4 7/27/16 Figure 2 Procedure 1. Set up the apparatus as shown in Figure 1 above. Arrange the photogate such that it is blocked and unblocked by the pulley as in Figure 2. 2. Balance the air track by following procedure given by your instructor. Set up the system with the hanging mass (m) at least 20g. Attach a string (about 1.5m long) to it and to the glider. The hook accessory is attached to one end of the glider (balanced by some other accessory on the other end of the glider). The mass of the glider with accessories is M. 3. This step works best with 2 people. One will move the glider backwards until the mass hanger almost touches the pulley. Then the other will click the ‘Collect’ button . When the ‘Collect’ button changes to ‘Stop’ the first person will release the cart. The mass hanger will fall downward pulling the glider along the air track. Click the ‘Stop’ button to stop timing before the glider reaches the end of the track. 4. The computer will then display a Velocity vs. Time graph where the slope is the acceleration of the system. Next, go to Analyze on the menu bar and go down to Linear Fit. The computer will then display a linear equation from which you can get the slope. The value of slope is your experimental acceleration. NRG 1405 99030397 Page 2 of 4 7/27/16 5. Compare the theoretical acceleration (found from Equation 1) with the actual measured acceleration and calculate a % error. 6. Increase the hanging mass and repeat the above procedure. DATA Part 1: Hanging mass 20g. Hanging Mass, m = _________grams Mass of glider, M = ___________ grams Accepted acceleration, mg = __________cm/s2 ( M m) Experimental acceleration = slope of velocity vs. time graph ____________ cm/s2 % Error = A E A x100 = ___________% Part 2: Hanging mass 30g. Hanging Mass, m = _________grams Mass of glider, M = ___________ grams Accepted acceleration, mg = __________cm/s2 ( M m) Experimental acceleration = slope of velocity vs. time graph ____________ cm/s2 % Error = A E A x100 = ___________% 7. Your instructor may want you to create a chart using other masses to collect further data. 8. Increase the mass of the glider and repeat the data collection procedure outlined above. DATA Part 3: Add 100g. mass to glider. Use constant hanging mass. Hanging Mass, m = _________grams NRG 1405 99030397 Page 3 of 4 7/27/16 Mass of glider, M = ___________ grams Accepted acceleration, mg = __________cm/s2 ( M m) Experimental acceleration = slope of velocity vs. time graph ____________ cm/s2 % Error = A E A x100 = ___________% Part 4: Add another 100g. to glider for a total of 200g. added. Use same hanging mass as you used in Part 3. Hanging Mass, m = _________grams Mass of glider, M = ___________ grams Accepted acceleration, mg = __________cm/s2 ( M m) Experimental acceleration = slope of velocity vs. time graph ____________ cm/s2 % Error = A E A x100 = ___________% NRG 1405 99030397 Page 4 of 4
