PHYS 1402 General Physics II RC Circuits: Capacitor Charge & Discharge
advertisement

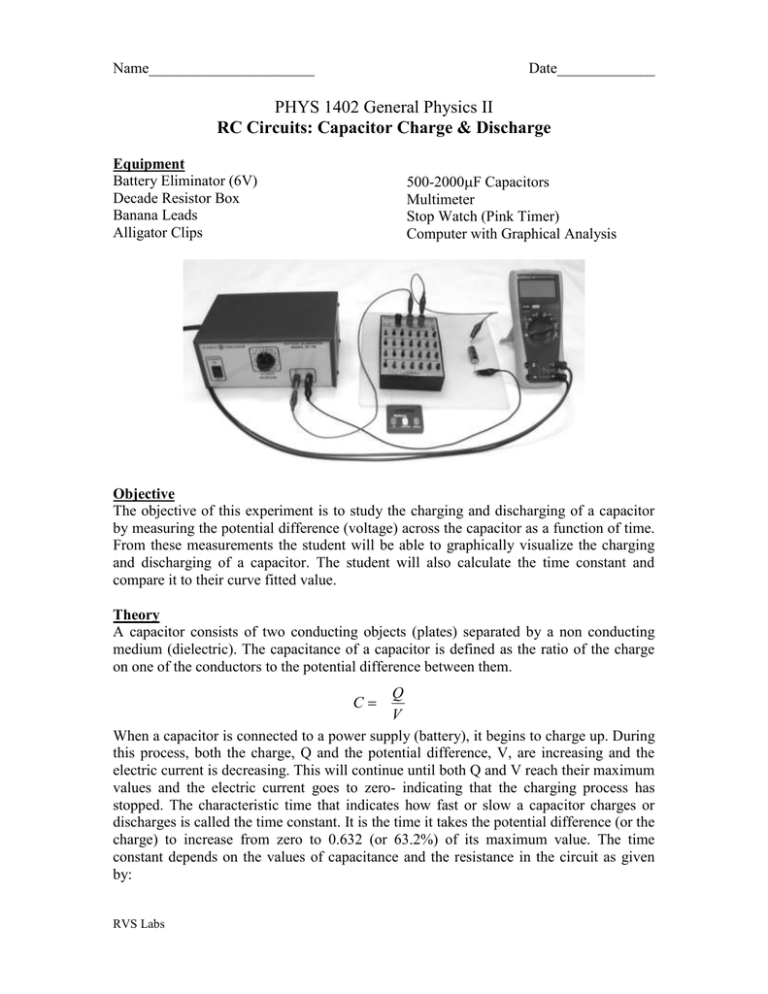
Name______________________ Date_____________ PHYS 1402 General Physics II RC Circuits: Capacitor Charge & Discharge Equipment Battery Eliminator (6V) Decade Resistor Box Banana Leads Alligator Clips 500-2000F Capacitors Multimeter Stop Watch (Pink Timer) Computer with Graphical Analysis Objective The objective of this experiment is to study the charging and discharging of a capacitor by measuring the potential difference (voltage) across the capacitor as a function of time. From these measurements the student will be able to graphically visualize the charging and discharging of a capacitor. The student will also calculate the time constant and compare it to their curve fitted value. Theory A capacitor consists of two conducting objects (plates) separated by a non conducting medium (dielectric). The capacitance of a capacitor is defined as the ratio of the charge on one of the conductors to the potential difference between them. Q V When a capacitor is connected to a power supply (battery), it begins to charge up. During this process, both the charge, Q and the potential difference, V, are increasing and the electric current is decreasing. This will continue until both Q and V reach their maximum values and the electric current goes to zero- indicating that the charging process has stopped. The characteristic time that indicates how fast or slow a capacitor charges or discharges is called the time constant. It is the time it takes the potential difference (or the charge) to increase from zero to 0.632 (or 63.2%) of its maximum value. The time constant depends on the values of capacitance and the resistance in the circuit as given by: C RVS Labs = RC A capacitor needs 5 time constants to charge up to 0.993 (or 99.3%) of maximum value. When this happens we will assume the capacitor is fully charged. Procedure 1. Discharge your capacitor by grounding the leads. 2. Measure C with your meter and record its value_________F ____________F 3. Discharge your capacitor again. 4. Calculate the resistance needed to achieve a value of 5 time constants in 5 minutes. Rcalculated= ___________ 5. Set the decade resistor box to the calculated value of R, then measure it’s actual value with your ohmmeter. Now add/substract resistance on the decade box until Rmeasured is as close to Rcalculated as possible. Record Rmeasured = ____________ 6. Wire the circuit as shown below: NOTE: Polarity of the capacitor is important!!! Figure 1 RC Circuit Diagram 7. Set your power supply voltage to 6 volts. Record the voltage every 10 seconds in your table. When turning on the multimeter, be sure to hold down the yellow button so as to disable the Auto Shut-off feature. Turn the power supply on and start the timer. You will record while charging for 5 minutes. Upon reaching the 5 minute mark you will IMMEDIATELY switch to the discharge circuit by disconnecting the positive power supply lead and connecting it directly on top of the ground lead. Turn off the power supply. Keep recording V every 10 seconds for another 5 minutes. RVS Labs Data and Analysis 1. Using the Graphical Analysis software, plot V versus t for both the charging and discharging cycles on the same graph. 2. Curve Fitting Click and drag the cursor across the charging phase of your graph to highlight these data points. Click the Analyze menu and select Curve Fit. In the dialog box that appears, click the “Define Function…” button. Now, fill in the “f(x)=” field with the equation describing the potential across a charging capacitor. Click “Try Fit” and then press “OK.” Charging capacitor Discharging capacitor V f (x) A*(1 exp(x / B)) V f (x) A*exp(x / B) Your fit results will appear in a small box next to your curve with B representing your measured time constant, . 3. Fit a curve to the discharging phase of your graph using the appropriate formula. 4. Compare the experimental graph values for with your calculated time constant by calculating a percent difference for each of the charging and discharging phases. % Differencech arg ing graph calculated graph calculated % Differencedisch arg ing graph calculated graph calculated RVS Labs 2 2 Data Table time (s) Voltage (V) 0 10 20 30 40 50 60 70 80 90 100 110 120 130 140 150 160 170 180 190 200 210 220 230 240 250 RVS Labs time (s) 310 320 330 340 350 360 370 380 390 400 410 420 430 440 450 460 470 480 490 500 510 520 530 540 550 560 Voltage (V) 260 270 280 290 300 RVS Labs 570 580 590 600 610


