1 modified after Minichillo, 2005. The elliptical and wide-arched bases intergrade.
advertisement

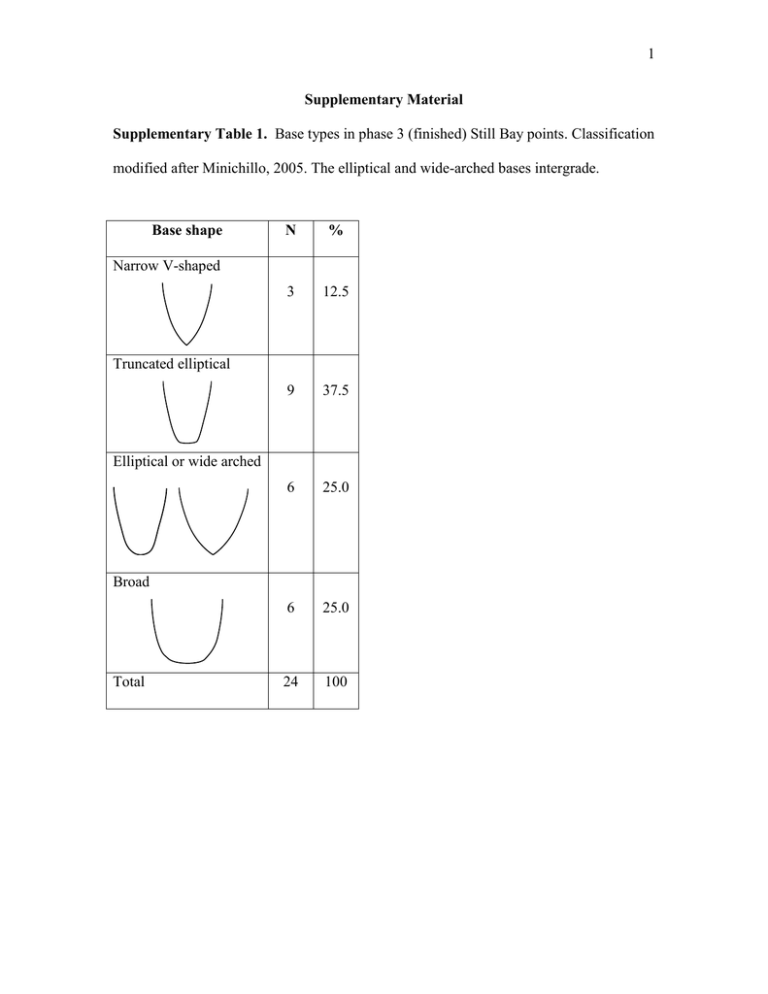
1 Supplementary Material Supplementary Table 1. Base types in phase 3 (finished) Still Bay points. Classification modified after Minichillo, 2005. The elliptical and wide-arched bases intergrade. Base shape N % 3 12.5 9 37.5 6 25.0 6 25.0 24 100 Narrow V-shaped Truncated elliptical Elliptical or wide arched Broad Total 2 Supplementary Table 2. Mean width and thickness of Solutrean shouldered points, standard deviation and coeffcient of variation. Data from Geneste and Plisson, 1990. Mean SD CV n Width 14 2.36 16.9 931 Thickness 4.3 0.93 21.6 1082 Supplementary Table 3. Frequency of impact scars on points of known function in Northern Europe (arrowheads) and North America (Paleoindian spear tips from Casper, Wyoming). Site, age and kinds of points Type of site Residential No. of points suitable for analysis 30 No. of impact scars 9 % of impact scars 30.0 Muldbjerg about 2800 bc, transverse arrowheads Præstelyng about 3200 bc, transverse arrowheads Vejlebro, level 8 about 3500 bc, transverse arrowheads Vejlebro, level 9 about 3500 bc, transverse arrowheads Stellmoor, upper level, end of the last glacial, tanged points Bromme, end of the last glacial, tanged points Ommelshoved, end of the last glacial, tanged points Casper, 10 060 ±170 BP with Hell Gap bifacial points Residential 56 8 14.3 Residential 24 5 20.8 Residential 42 2 4.8 Reindeer kill site (MNI = 302) 45 19 42.2 Residential 47 3 6.4 Residential 88 11 12.5 Bison kill site MNI = 74 60 26 43% 3 Bromme and Ommelshoved belong to the Brommian culture dated to the Alleröd (about 13,000 B.P.); Stellmoor, upper level, belongs to the Ahrensburgian and is dated to the Younger Dryas (about 12,000 B.P.). Stellmoor has yielded 105 whole and fragmented arrows made of pinewood with a 20 cm long foreshaft. Some foreshafts had simple pointed wooden tips, others were armed with Ahrensburg points (small tanged and obliquely truncated tips) and impact scars are very common (42.2%). Thirty identified bones, plus two antlers, have lesions with embedded pieces of flint. Data from Fischer et al., 1984, Frison, 1974 and Bratlund, 1996. Supplementary Table 4. Width/thickness ratios of Folsom and Still Bay points. This ratio is a way of controlling for size variation. Width/thickness ratio Folsom type site Blombos N 13 23 Mean 5.5 2.8 Sd 0.8 0.4 Min 4.1 2.0 Max 7.3 3.7 Supplementary Discussions TCSA data sets for Table 4 of text Data on Sibudu from Villa and Lenoir, 2006, Villa and Lenoir, in press; on Paleoindian points from Frison, 1974; Wheat 1972, 1979; Meltzer, 2007; Huckell, 2007. Data for ethnographic and recent archaeological hafted stone points (dart tips and arrowheads) are 4 from Shea (2006) and are based on ethnographic and North American archeological materials (Thomas, 1978; Shott, 1997; Hughes, 1998). Data for spear tips are based on Shea’s experiments; he notes that his data should be used with caution but that the TCSA mean of spears is significantly larger than arrowheads and dart tips. The TCSA of Solutrean shouldered points from four sites in Southwestern France is calculated from mean width and thickness provided by Geneste and Plisson, 1990. Note that their value falls within the range of arrowheads. The CV of arrowheads is very high by comparison with the archaeological samples; this is not surprising since it consists of 118 specimens from 24 tribes throughout North America. The CV of darts is smaller as the sample comes from 10 sites mostly in the American Southwest. Previously published TCSA values. Shea (2006: table 3) has published two different TCSA values of Blombos Still Bay points based on two samples: the first sample has a TCSA mean of 143 (SD = 109, min = 4, max = 842, n = 239), the second has a mean of 100 (SD =53, min = 4, max = 199, n = 190). The second TCSA value is essentially the same as our based only on phase 3 points (TCSA = 99; SD = 48.5, min = 28.8, max = 190.4, n = 23). Since Shea’s second TCSA value is based on a sample that contains finished and unfinished points, it has been suggested that unfinished points should be considered as functionally equivalent to finished (phase 3) points. Table 5 in the text shows that the TCSA of phases 2 and 3 points are statistically different but the nature of Shea’s sample also needs some explanation. Shea’s analysis was based on Marie Soressi’ initial data base which contained only 203 points instead of the 352 analyzed by us. Using all those pieces resulted in an excessive high value of TCSA and so he excised all the values between 200 and 842 5 (Shea, 2006: 828) getting a more “normal” result. The limit chosen for excising the high values was of course arbitrary since Shea did not know the number of preforms, incomplete and broken specimens present in his sample. More importantly, M.S. data base did not provide a way of distinguishing incomplete width and thickness measurements (due to the fact that the point is broken) from the complete ones. Having excised the high values, which, based on his large experience, were clearly unacceptable, he then reached a very anomalous minimal value of 4 mm2 and a mean value which is as low as expected (for spear tips) but is based on a very large number of incomplete measurements, smaller than the original piece. MS data base in fact included only 26 complete or almost complete specimens but this number includes a majority of unfinished preforms (our phase 1 and 2). Our current data base, instead, includes coding indicating whether the width and thickness measurements are complete and can be used to calculate a TCSA value or not. In sum, Shea’s second TCSA values came close to being right but are based on a priori decision and erroneous data. Supplementary References Bratlund, B., 1996. Hunting strategies in the Late Glacial of Northern Europe: a survey of the faunal evidence. Journal of World Prehistory 10, 1-48. Wheat, J. B., 1972. The Olsen-Chubbuck site. A Paleoindian bison kill. Memoirs of the Society for American Archaeology, no. 26.

