Discrete numbers are integers. Continuous values are all real numbers.
advertisement
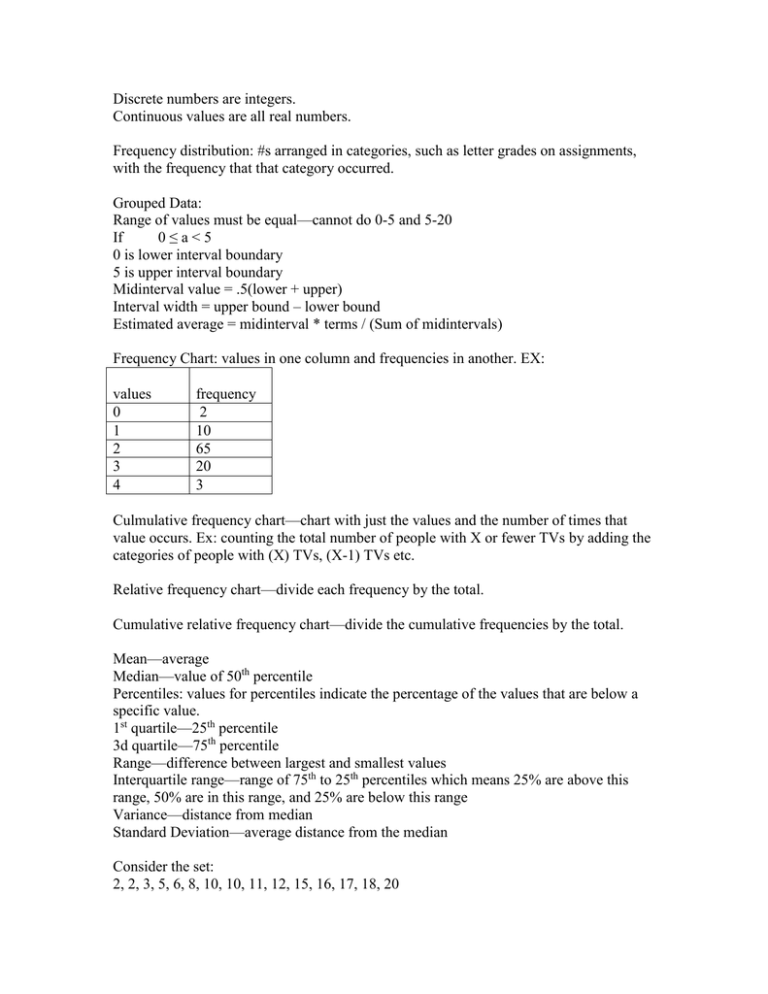
Discrete numbers are integers. Continuous values are all real numbers. Frequency distribution: #s arranged in categories, such as letter grades on assignments, with the frequency that that category occurred. Grouped Data: Range of values must be equal—cannot do 0-5 and 5-20 If 0≤a<5 0 is lower interval boundary 5 is upper interval boundary Midinterval value = .5(lower + upper) Interval width = upper bound – lower bound Estimated average = midinterval * terms / (Sum of midintervals) Frequency Chart: values in one column and frequencies in another. EX: values 0 1 2 3 4 frequency 2 10 65 20 3 Culmulative frequency chart—chart with just the values and the number of times that value occurs. Ex: counting the total number of people with X or fewer TVs by adding the categories of people with (X) TVs, (X-1) TVs etc. Relative frequency chart—divide each frequency by the total. Cumulative relative frequency chart—divide the cumulative frequencies by the total. Mean—average Median—value of 50th percentile Percentiles: values for percentiles indicate the percentage of the values that are below a specific value. 1st quartile—25th percentile 3d quartile—75th percentile Range—difference between largest and smallest values Interquartile range—range of 75th to 25th percentiles which means 25% are above this range, 50% are in this range, and 25% are below this range Variance—distance from median Standard Deviation—average distance from the median Consider the set: 2, 2, 3, 5, 6, 8, 10, 10, 11, 12, 15, 16, 17, 18, 20 There are 15 values. We shall call this (n) The median for odd values of n is the middle number, in this case 10. The median for even n values is the average of the two middle values. In general, if we wish to find the value for the kth percentile, it is k*n/100. If this value is an integer value (5 for example), average that value with the next (so take the average of the 5th and 6th values). If the value is not an integer, take the ceiling value of n*k/100, or ┌n*k/100┐, the next highest integer value and take the value there. So, to find the interquartile range, of the n = 15 series above, take ┌15*25/100┐= 4 and ┌15*75/100┐= 12. the 4th value is 5 and the 12th value is 16. thus the interquartile range is 16 – 5 = 11. For an unbiased estimate of the variance of a function, sum the variance of each n value. The estimate for the population (Sn-1) will equal n/(n – 1) times the sample variance (Sn) Or: Sn-1 = Sn *n/(n – 1) Int values [1,000,000] creates 1 million cells labeled 0 to 999,999 under the heading “values”. Long has more storage space, but double is greater.
