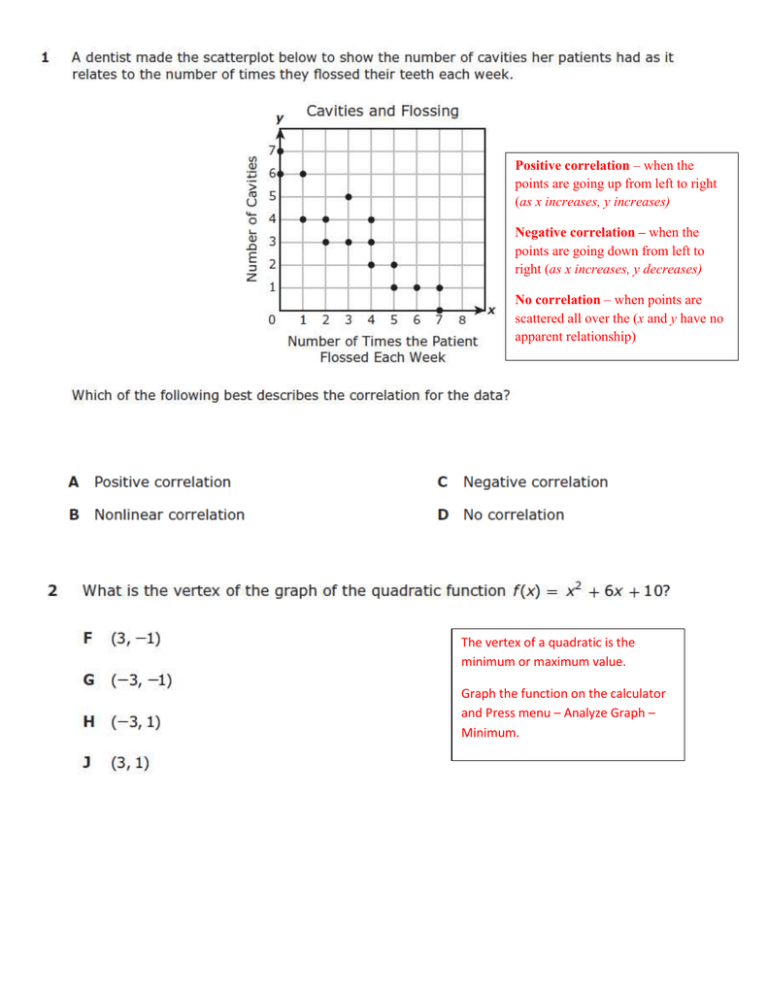
points are going up from left to right
advertisement

Positive correlation – when the points are going up from left to right (as x increases, y increases) Negative correlation – when the points are going down from left to right (as x increases, y decreases) No correlation – when points are scattered all over the (x and y have no apparent relationship) The vertex of a quadratic is the minimum or maximum value. Graph the function on the calculator and Press menu – Analyze Graph – Minimum. Parallel lines have no intersection – no solution. Since 𝑑𝑖𝑠𝑡𝑎𝑛𝑐𝑒 = 𝑟𝑎𝑡𝑒 𝑥 𝑡𝑖𝑚𝑒, 𝑡𝑖𝑚𝑒 = 𝑑𝑖𝑠𝑡𝑎𝑛𝑐𝑒 . 𝑟𝑎𝑡𝑒 Slope is the rate of change of a function Draw a diagram. 𝑃𝑒𝑟𝑖𝑚𝑒𝑡𝑒𝑟 = 2(𝑙𝑒𝑛𝑔𝑡ℎ) + 2(𝑤𝑖𝑑𝑡ℎ) Substitute the expressions for Perimeter, length, and width and solve for x. Substitute what you get for x into the expressions for length and width. Graph the equations and match with the given graph. Graph the equation and compare the table with the answer choices. Select a number for c that is greater than 3, and substitute it into the given expression to calculate the value. Then compare to the expressions in the steps.


