Grade Math John Drugan 2015-Targeted TEKS 3rd Nine Weeks 8
advertisement

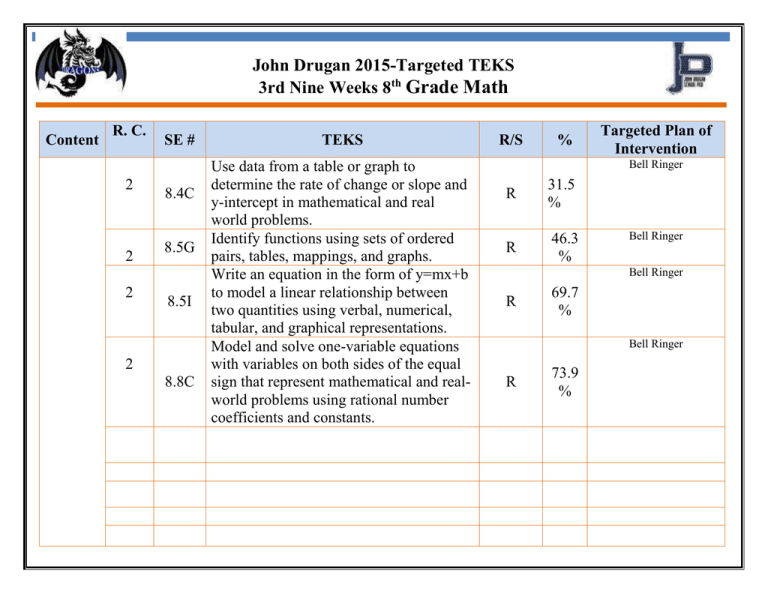
John Drugan 2015-Targeted TEKS 3rd Nine Weeks 8th Grade Math Content R. C. 2 2 2 SE # 8.4C 8.5G 8.5I 2 8.8C TEKS Use data from a table or graph to determine the rate of change or slope and y-intercept in mathematical and real world problems. Identify functions using sets of ordered pairs, tables, mappings, and graphs. Write an equation in the form of y=mx+b to model a linear relationship between two quantities using verbal, numerical, tabular, and graphical representations. Model and solve one-variable equations with variables on both sides of the equal sign that represent mathematical and realworld problems using rational number coefficients and constants. R/S % Targeted Plan of Intervention Bell Ringer R 31.5 % R 46.3 % Bell Ringer Bell Ringer R 69.7 % Bell Ringer R 73.9 % John Drugan 2015-Targeted TEKS 3rd Nine Weeks 8th Grade Math

