Fish in Hot Water Name:_________________________________ Date:_____________ Period:______
advertisement

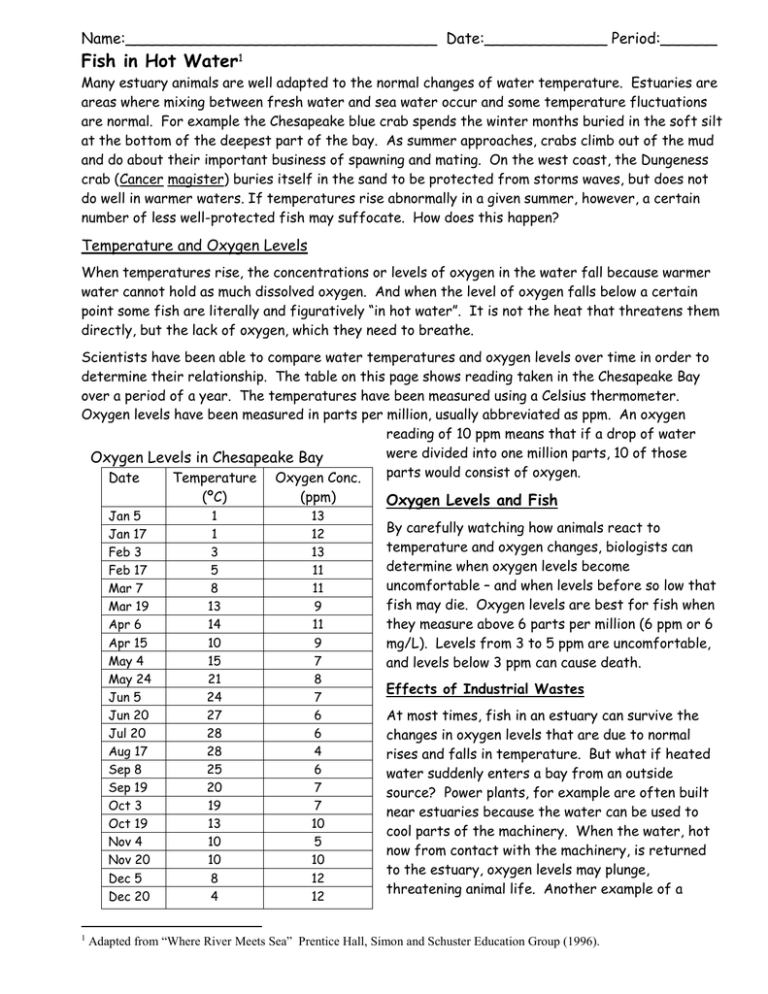
Name:_________________________________ Date:_____________ Period:______ Fish in Hot Water1 Many estuary animals are well adapted to the normal changes of water temperature. Estuaries are areas where mixing between fresh water and sea water occur and some temperature fluctuations are normal. For example the Chesapeake blue crab spends the winter months buried in the soft silt at the bottom of the deepest part of the bay. As summer approaches, crabs climb out of the mud and do about their important business of spawning and mating. On the west coast, the Dungeness crab (Cancer magister) buries itself in the sand to be protected from storms waves, but does not do well in warmer waters. If temperatures rise abnormally in a given summer, however, a certain number of less well-protected fish may suffocate. How does this happen? Temperature and Oxygen Levels When temperatures rise, the concentrations or levels of oxygen in the water fall because warmer water cannot hold as much dissolved oxygen. And when the level of oxygen falls below a certain point some fish are literally and figuratively “in hot water”. It is not the heat that threatens them directly, but the lack of oxygen, which they need to breathe. Scientists have been able to compare water temperatures and oxygen levels over time in order to determine their relationship. The table on this page shows reading taken in the Chesapeake Bay over a period of a year. The temperatures have been measured using a Celsius thermometer. Oxygen levels have been measured in parts per million, usually abbreviated as ppm. An oxygen reading of 10 ppm means that if a drop of water were divided into one million parts, 10 of those Oxygen Levels in Chesapeake Bay parts would consist of oxygen. Date Temperature Oxygen Conc. Jan 5 Jan 17 Feb 3 Feb 17 Mar 7 Mar 19 Apr 6 Apr 15 May 4 May 24 Jun 5 Jun 20 Jul 20 Aug 17 Sep 8 Sep 19 Oct 3 Oct 19 Nov 4 Nov 20 Dec 5 Dec 20 1 (ºC) (ppm) 1 1 3 5 8 13 14 10 15 21 24 27 28 28 25 20 19 13 10 10 8 4 13 12 13 11 11 9 11 9 7 8 7 6 6 4 6 7 7 10 5 10 12 12 Oxygen Levels and Fish By carefully watching how animals react to temperature and oxygen changes, biologists can determine when oxygen levels become uncomfortable – and when levels before so low that fish may die. Oxygen levels are best for fish when they measure above 6 parts per million (6 ppm or 6 mg/L). Levels from 3 to 5 ppm are uncomfortable, and levels below 3 ppm can cause death. Effects of Industrial Wastes At most times, fish in an estuary can survive the changes in oxygen levels that are due to normal rises and falls in temperature. But what if heated water suddenly enters a bay from an outside source? Power plants, for example are often built near estuaries because the water can be used to cool parts of the machinery. When the water, hot now from contact with the machinery, is returned to the estuary, oxygen levels may plunge, threatening animal life. Another example of a Adapted from “Where River Meets Sea” Prentice Hall, Simon and Schuster Education Group (1996). thermal discharge occurs at wastewater treatment plants. After the waste water is treated it is warmer than the river, estuary, or ocean water that receives the treated water. The City of Sacramento discharges its treated wastewater into the Sacramento River and under its permit must monitor temperatures so that the City does not create a situation that is harmful for the aquatic life in the Sacramento River. In order to use temperature as an indicator of possible dissolved oxygen concentrations, scientists graph their results to visualize data patterns. Below are two grids in which you are to graph the data collected from the Chesapeake Bay last year. One graph is temperature vs. dissolved oxygen concentration to show the relationship between temperature and oxygen. One graph is time vs. dissolved oxygen and temperature to show how dissolved oxygen and temperature changes during a year. When graphing don’t forget to label the x axis, y axis, and to title your graph. Once you have plotted points draw, using a ruler, a trendline showing how data trend. You will use this trendline to make predictions. Using your graph, predict what the dissolved oxygen concentration would be at 9ºC. Explain how you came up with the prediction. Using the above graph discuss how you think oxygen levels in an estuary might be likely to rise or fall during a cold spell. Science News Press article assignment The former PG&E power plant in Moss Landing was purchased several years ago by Duke Energy, who in October 2000 received permits to expand the power plant to 1,060 megawatts, making it the largest (in terms of power output) power plant in California. The existing power plant uses water pulled from Moss Landing Harbor to cool the turbines and discharges that "thermal cooling water" into the Pacific Ocean, and partially into the Sanctuary, through outfall pipes offshore of the Monterey Bay Aquarium Research Institute. The planned expansion calls for increasing the amount of cooling water to a total of approximately 1.2 billion gallons per day at peak operating capacity. This is by far the largest discharge into the Monterey Bay National Marine Sanctuary.2 The Ray News has begun to investigate the effects of operating this power plant. For a first story you are to write a short (200 word) commentary article about the permitting of a power plant adjacent to a marine sanctuary. Use the PROOF PARAGRAGH strategy. Before you start, list out some of your thoughts for and against the project to gather talking points. Discuss your ideas with your elbow neighbor. Write a rough draft first. Write your final using good penmanship. As your publisher I expect you to polish your writing so that your star is shining. 2 http://montereybay.noaa.gov/educate/newsletters/2001winternewsletter/simon.html


