Name:_____________________________________ Date:_________________ Period:___ and describing terms: linear, non-linear, measurements vary inversely, G B
advertisement

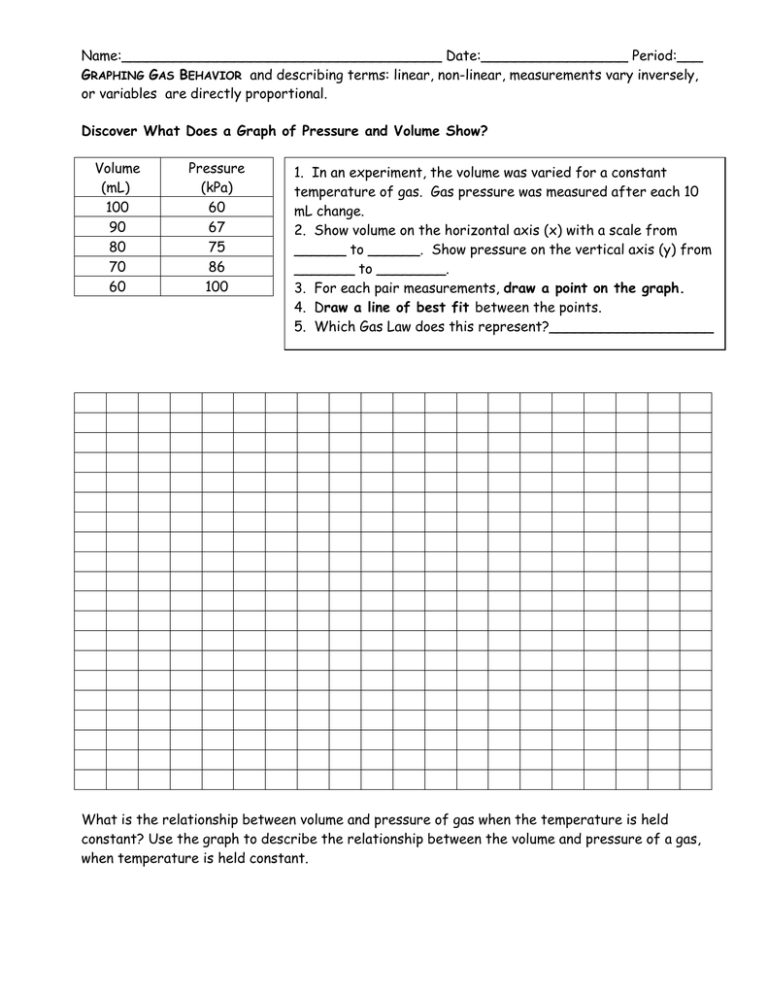
Name:_____________________________________ Date:_________________ Period:___ GRAPHING GAS BEHAVIOR and describing terms: linear, non-linear, measurements vary inversely, or variables are directly proportional. Discover What Does a Graph of Pressure and Volume Show? Volume (mL) 100 90 80 70 60 Pressure (kPa) 60 67 75 86 100 1. In an experiment, the volume was varied for a constant temperature of gas. Gas pressure was measured after each 10 mL change. 2. Show volume on the horizontal axis (x) with a scale from ______ to ______. Show pressure on the vertical axis (y) from _______ to ________. 3. For each pair measurements, draw a point on the graph. 4. Draw a line of best fit between the points. 5. Which Gas Law does this represent?___________________ What is the relationship between volume and pressure of gas when the temperature is held constant? Use the graph to describe the relationship between the volume and pressure of a gas, when temperature is held constant. Discover What Does a Graph of Pressure and Temperature Show? 1. In an experiment, the temperature was varied for a constant volume of gas. Gas pressure was measured after each 5o C change. Convert to Kelvins. 2. Show temperature on the horizontal (x) axis with a scale from ______ to ______. Show pressure on the vertical (y) axis from _______ to ________. Label axes. 3. For each pair measurements, draw a point on the graph. 4. Draw a line of best fit between the points. 5. Which Gas Law does this represent?______________________________________ Temperature (oC) 0 5 10 15 20 25 Temperature (K) Pressure (kPa) 8 11 14 17 20 23 What is the relationship between pressure and temperature of gas when the volume is held constant? Use the graph to describe the relationship between the pressure and temperature of a gas, when volume is held constant. Discover What Does a Graph of Temperature and Volume Show? 1. In an experiment, the temperature was varied for a constant pressure of gas. Volume measured after each 10 K change. 2. Show temperature on the horizontal axis with a scale from ______ to ______. Show volume on the vertical axis from _______ to ________. 3. For each pair measurements, draw a point on the graph. 4. Draw a line of best fit between the points. 5. Which Gas Law does this represent?__________________________________________ Temperature (K) 273 283 293 303 313 323 333 343 353 363 373 Volume (mL) 50 52 54 56 58 60 62 63 66 67 69 What is the relationship between volume and temperature of gas when the pressure is held constant? Use the graph to describe the relationship between the volume and temperature of a gas, when pressure is held constant. Define the following Graph Kelvin Horizontal Axis Vertical Axis Manipulated Variable Responding Variable Linear Relationship Non-linear Relationship Directly Proportional Varies Inversely What does a dashed line on a graph represent? How can you tell the difference between a graph in which on variable is directly proportional to another and a graph in which two variables vary inversely?

