Line Plots
advertisement
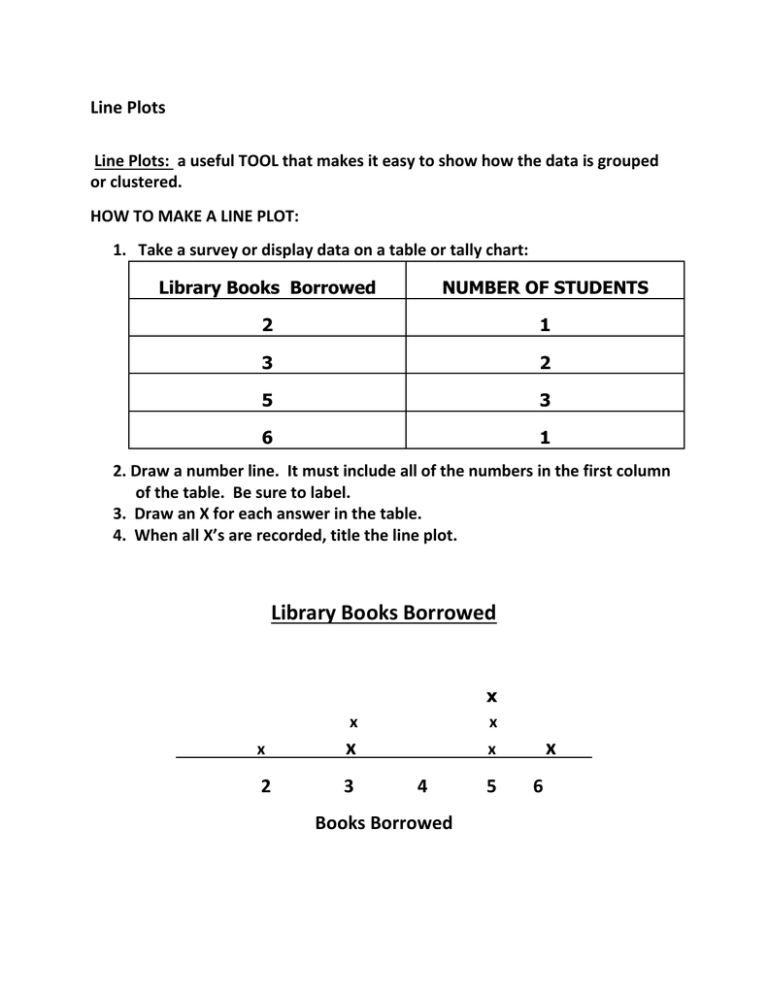
Line Plots Line Plots: a useful TOOL that makes it easy to show how the data is grouped or clustered. HOW TO MAKE A LINE PLOT: 1. Take a survey or display data on a table or tally chart: Library Books Borrowed NUMBER OF STUDENTS 2 1 3 2 5 3 6 1 2. Draw a number line. It must include all of the numbers in the first column of the table. Be sure to label. 3. Draw an X for each answer in the table. 4. When all X’s are recorded, title the line plot. Library Books Borrowed x x x x x x 2 3 4 Books Borrowed 5 x 6


