LA HARBOR COLLEGE Student Learning Outcomes (SLOs) Assessment Report Course Assessment
advertisement
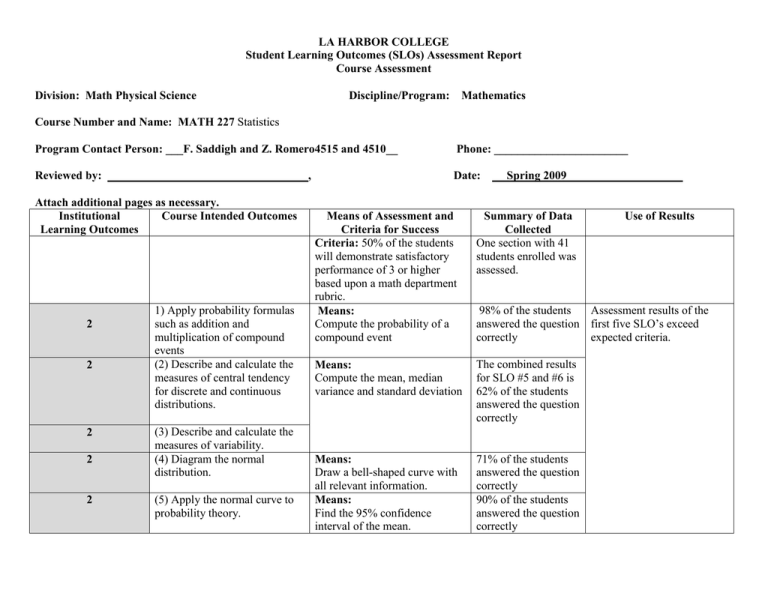
LA HARBOR COLLEGE Student Learning Outcomes (SLOs) Assessment Report Course Assessment Division: Math Physical Science Discipline/Program: Mathematics Course Number and Name: MATH 227 Statistics Program Contact Person: ___F. Saddigh and Z. Romero4515 and 4510__ Phone: _______________________ Reviewed by: Date: , Attach additional pages as necessary. Institutional Course Intended Outcomes Learning Outcomes 2 2 2 2 2 1) Apply probability formulas such as addition and multiplication of compound events (2) Describe and calculate the measures of central tendency for discrete and continuous distributions. (3) Describe and calculate the measures of variability. (4) Diagram the normal distribution. (5) Apply the normal curve to probability theory. Spring 2009 Means of Assessment and Criteria for Success Criteria: 50% of the students will demonstrate satisfactory performance of 3 or higher based upon a math department rubric. Means: Compute the probability of a compound event Summary of Data Collected One section with 41 students enrolled was assessed. Means: Compute the mean, median variance and standard deviation The combined results for SLO #5 and #6 is 62% of the students answered the question correctly Means: Draw a bell-shaped curve with all relevant information. Means: Find the 95% confidence interval of the mean. 71% of the students answered the question correctly 90% of the students answered the question correctly Use of Results 98% of the students Assessment results of the answered the question first five SLO’s exceed correctly expected criteria. 2 (6) Describe and calculate the measure of correlation Means: Test the significance of r. State the hypotheses. Find the critical values, make the decision and analyze the results.
