A relation between the price of a good... that consumers are willing and able to buy during a Demand:
advertisement
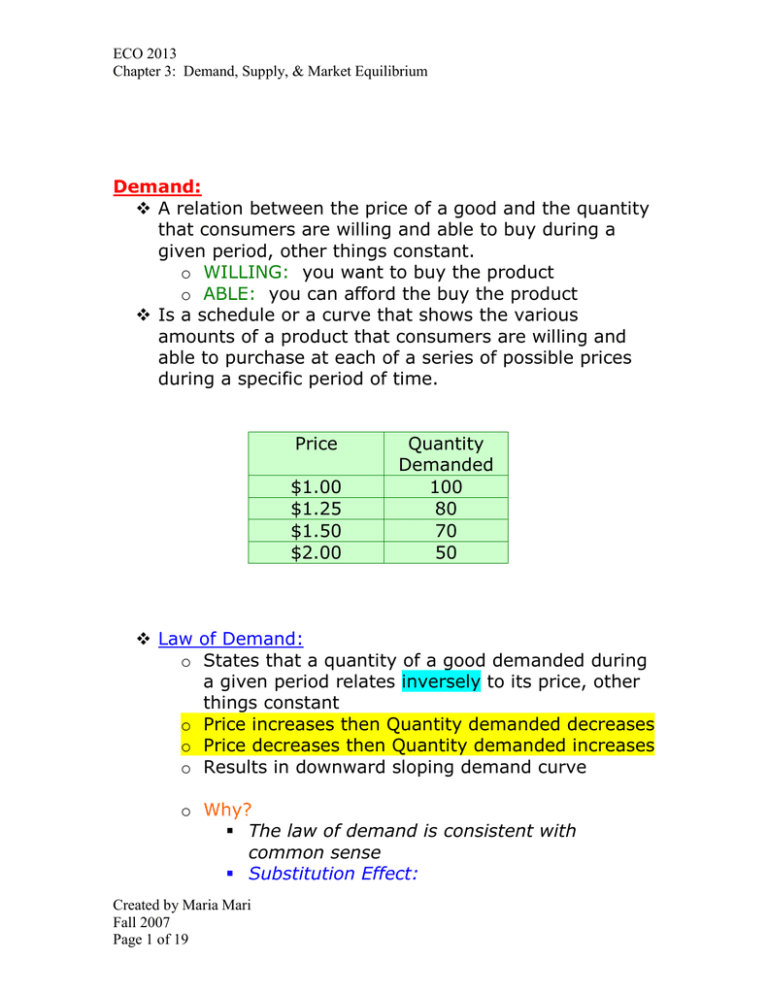
ECO 2013 Chapter 3: Demand, Supply, & Market Equilibrium Demand: A relation between the price of a good and the quantity that consumers are willing and able to buy during a given period, other things constant. o WILLING: you want to buy the product o ABLE: you can afford the buy the product Is a schedule or a curve that shows the various amounts of a product that consumers are willing and able to purchase at each of a series of possible prices during a specific period of time. Price $1.00 $1.25 $1.50 $2.00 Quantity Demanded 100 80 70 50 Law of Demand: o States that a quantity of a good demanded during a given period relates inversely to its price, other things constant o Price increases then Quantity demanded decreases o Price decreases then Quantity demanded increases o Results in downward sloping demand curve o Why? The law of demand is consistent with common sense Substitution Effect: Created by Maria Mari Fall 2007 Page 1 of 19 ECO 2013 Chapter 3: Demand, Supply, & Market Equilibrium Unlimited wants and scarce resources cause this. It is when the price of a good falls, consumers substitute that good for other goods, which become relatively more expensive. Income Effect: Money income: is simply the number of dollars received per period. Real income: your income measured in terms of what it can buy A fall in the price of good increases’ consumers’ real income making consumers more able to purchase goods: for a normal good, the quantity demanded increases. Demand Schedule and Curve o Demand curve: a curve showing the relation between the price of a good and the quantity demanded during a given period, other things constant o Suppose we produce pizza, here is the demand schedule Created by Maria Mari Fall 2007 Page 2 of 19 Price of Good Quantity Demanded $3 200 $4 150 $5 100 ECO 2013 Chapter 3: Demand, Supply, & Market Equilibrium $6 75 $7 50 Notice that as the price increases, quantity demanded decreases. Drawing the curve: The demand curve is downward sloping due to the inverse relationship between price and $6 Notice: every point onA the line matches the schedule. It is a quantity demanded. price/quantity demanded that consumers are willing and able to buy. $5 B Price $4 o Movement along the Demand Curve $3 o Caused by a change in price and ONLY a change in price $2 o You will move form one point to another on the Demand $1 same graph. o Such as in the above graph we go from $5 to $4, the $0 quantity demand increases from 75 to 150 units. 50 75 100 150 200 Quantity o When a price changes then we have a Change in Quantity Demanded. o Determinants of Demand o These are the other things constant o They are Consumers’ tastes Number of buyers in the market Consumers’ income The price of related goods Created by Maria Mari Fall 2007 Page 3 of 19 ECO 2013 Chapter 3: Demand, Supply, & Market Equilibrium Consumer expectations o Changes in Demand Extremely important !!! o A demand curve isolates the relation between prices of a good and quantities demanded when other factors that could affect demand remain unchanged. o o Called ASSUMPTIONS OR DETERMINANTS Change in consumer income Change in prices of related goods Changes in consumer expectations Changes in the number of consumers Changes in consumer tastes or preferences o Changes in determinants Results in changes to the relationship between PRICE and QUANTITY DEMANDED At each and every price a DIFFERENT quantity is demanded. Results in a shift in the demand curve. Increase in Demand at each and every price MORE of the good is demanded consumers are willing to purchase more quantities of the good at each price. shifts the demand curve to the right P Qd1 Qd2 $4 150 200 Created by Maria Mari Fall 2007 Page 4 of 19 ECO 2013 Chapter 3: Demand, Supply, & Market Equilibrium $5 100 150 $6 75 100 Note: Qd1 is the demand schedule that originally existed for the product. After a change in one of the determinants that resulted in an increase in DEMAND, a new demand schedule Qd2 is created. At each and every price more of the good is demanded. Check out price of $5. Price The demand curve shifts to the right. What causes an increase in demand? o Increase in consumer income o Consumers have more money, they spend on $5 more of everything Qd2 o Normal goods A good for which Qd1 demand increases as consumer income rise o Inferior goods Quantity A good which demand increases as consumer 100falls 150 income Bus o Change in Price of Related goods o Some goods are related to other goods in that consumption of one affects the consumption of the other good o Substitutes: goods that are not consumed jointly such as coke and Pepsi goods that are related in such a way than an increase in the price of one increases the demand for the other Created by Maria Mari Fall 2007 Page 5 of 19 ECO 2013 Chapter 3: Demand, Supply, & Market Equilibrium increase in the price of Pepsi, increase the demand for Coke o Complements Goods that are related in such a way that an decrease in the price of one will increase the demand for the other DVD player and DVDs Decrease in the price of DVD players, increases demand for DVDs Must be consumed jointly o Changes in consumer tastes or preferences o Consumer preferences: likes or dislikes in consumption are assumed not to change along the demand curve o But if taste change so does demand o VHS, platform shoes o Changes in Consumer Expectations o As prices and income o Affect how consumers spend their money and their demand o If we think that the product will be more expensive tomorrow, we will buy today o Changes in the number and composition of consumers o The market demand curve is the sum of the individual demand curves o If the number of consumers fall then demand falls Decrease in Demand at each and every price LESS of the good is demanded Created by Maria Mari Fall 2007 Page 6 of 19 ECO 2013 Chapter 3: Demand, Supply, & Market Equilibrium no matter what price, consumers buy less quantities shifts the demand curve to the right P Qd1 Qd2 $4 150 130 $5 100 90 $6 75 60 Note: Qd1 is the demand schedule that originally existed for the product. After a change in one of the determinants that resulted in a decrease in DEMAND, a new demand schedule Qd2 is created. At each and every price less of the good is demanded. Check out price of $5. Price The demand curve shifts to the left. What causes a decrease in demand? $5 o Decrease in consumer income Qd1 o Consumers have less money, they spend less of Qd2 everything 100 Quantity o Change in90Price of Related goods o Some goods are related to other goods in that consumption of one affects the consumption of the other good o Substitutes: goods that are not consumed jointly such as Coke and Pepsi Created by Maria Mari Fall 2007 Page 7 of 19 ECO 2013 Chapter 3: Demand, Supply, & Market Equilibrium goods that are related in such a way than an decrease in the price of one increases the demand for the other therefore an decrease in the price of Pepsi will reduce the demand for Coke o Complements Goods that are related in such a way that an increase in the price of one will decrease the demand for the other DVD player and DVDs Increase in price of DVD players will decrease demand for DVDs Must be consumed jointly o Changes in consumer tastes or preferences o Consumer preferences: likes or dislikes in consumption are assumed not to change along the demand curve o But if taste change so does demand o Vinyl, Tape, CD, iPod o Changes in Consumer Expectations o As prices and income o Affect how consumers spend their money and their demand o If we think that the product will be less expensive tomorrow, we will buy tomorrow o Changes in the number and composition of consumers o The market demand curve is the sum of the individual demand curves o If the number of consumers rises then demand rises Created by Maria Mari Fall 2007 Page 8 of 19 A change in quantity demanded is NOT a change in demand. Change in quantity ECO 2013 Chapter 3: Demand, Supply, & Market Equilibrium Supply The producer’s side A relation between the price of a good and the quantity that the producers are willing and able to offer for sale during a given period other things constant. Law of Supply” o The quantity of a good supplied during a given period is usually directly related to the price of the good. o An increase in the price of the good causes an increase in the quantity supplied. o A decrease in price leads to decrease in quantity supplied o Creates an upward sloping supply curve Price of Good $3 $4 $5 $6 $7 Quantity Demanded Price Movement along the supply $7 curve o Caused by a change in $6 50 price and only in price 75 $5 o Causes a movement 100 $4 along the supply curve o Called a Change in 150 $3 Quantity Supplied o Suppose that the price 200 changes from $4 to $3 $0 then quantity supplied 100 150 goes from 75 to 50 Determinants for the Supply Curve o Change in technology Created by Maria Mari Fall 2007 Page 9 of 19 Supply ECO 2013 Chapter 3: Demand, Supply, & Market Equilibrium o o o o Change in the prices of relevant resources Changes in the prices of alternative goods Changes n producer expectations Changes in the number of producers Changes in Supply o Caused by changes in the determinants to the supply curve o Results in changes to the relationship between the price and quantity supplied. o At each and every price a DIFFERENT quantity is supplied. o Results in a new supply curve: a shift in the curve Increase in Supply At each and every price MORE of the good is supplied P Qs1 Qs2 $4 150 180 $5 100 200 $6 75 100 Price Qs1 Qs2 $5 Created by Maria Mari Fall 2007 Page 10 of 19 Quantity 100 200 ECO 2013 Chapter 3: Demand, Supply, & Market Equilibrium What causes an increase in supply? Improvements in technology o Increases in efficiency and productivity at each and every price Changes in relevant resources o Are those employed in the production of the good in question o Decrease in the price of resources Results in an increase in supply. Producers are willing to produce more at lower price since their costs have fallen Changes in the prices of alternative goods o Other goods that use some or all of the same resources as the good in question o Beef and leather o If the price of beef increases, producers supply more beef, results in more leather at lower prices Changes in producers expectations o Expectation of increase in future prices of resources may cause producers to offer more today Changes in the number of producers o As the number of producers change so does the supply of the product o A increase in the number of producers will lead to an increase in supply Created by Maria Mari Fall 2007 Page 11 of 19 ECO 2013 Chapter 3: Demand, Supply, & Market Equilibrium Decrease in Supply At each and every price LESS of the good is supplied P Qs1 Qs2 $4 180 150 $5 200 100 $6 100 80 Price Qs2 Qs1 $5 Quantity 100 200 What causes a decrease in supply? Changes in relevant resources o Are those employed in the production of the good in question o Increase in the price of resources Results in a decrease in supply. Created by Maria Mari Fall 2007 Page 12 of 19 ECO 2013 Chapter 3: Demand, Supply, & Market Equilibrium Producers are willing to produce less at lower price since their costs have risen Changes in the prices of alternative goods o Other goods that use some or all of the same resources as the good in question o Beef and leather o If the price of beef decreases, producers supply less beef, results in less leather at all prices Changes in producers expectations o Expectation of decrease in future prices of resources may cause producers to offer less today Changes in the number of producers o As the number of producers change so does the supply of the product o A decrease in the number of producers will lead to an decrease in supply A change in quantity supplied is NOT a change in supply. Change in quantity supplied is caused by a change in PRICE Change in supply is caused by a change in the DETERMINANTS Created by Maria Mari Fall 2007 Page 13 of 19 ECO 2013 Chapter 3: Demand, Supply, & Market Equilibrium Market Equilibrium Market o Includes all the arrangements used to buy and sell o Reduces transaction costs o The place where buyers and sellers meet to determine price and quantity Equilibrium o A specific price where the quantity demanded is equal to the quantity supplied. o QUANTITY DEMANDED = QUANTITY SUPPLIED o Equilibrium Price = the market clearing price o Equilibrium Quantity where Demand = Supply The intersection of the demand and supply curves Price Supply Equilibrium Reaching Equilibrium Price o Competition among buyers and among sellers drives the price to the equilibrium price $6 Once there, it remains unless it isEQUILIBRIU M in subsequently disturbed by changes demand or supply o When a product enters the market, it may be Demand placed at a price too high or too low for equilibrium. If such, then the market moves Quantity toward equilibrium 150 o Price Above Equilibrium: If the market price is above equilibrium: Created by Maria Mari Fall 2007 Page 14 of 19 ECO 2013 Chapter 3: Demand, Supply, & Market Equilibrium Market price > Equilibrium Price Quantity supplied > Quantity demanded The economy has a surplus To reduce the surplus, the producers lower the price until they reach equilibrium. Surplus Qs > Qd Price Supply o Price Below Equilibrium: $7 If the market price is below equilibrium Price drops Market price < Equilibrium Price from $7 to $6 to $6 Quantity supplied < Quantity demanded The economy has a shortage reduce the surplus then quantity supplied will be less than quantity demanded. To reduce the shortage and get the products that they want, consumers will bid up the Demand price until they reach equilibrium. 100 145 Price 170 Supply The market will always move toward equilibrium if left alone. Rationing function of prices $6 Productive efficiency Price rises from $4 to $6 to eliminate Allocative efficiency the shortage $4 Shortage Qd > Qs Demand Shifts in Demand and Supply & Equilibrium 76 82 98 Demand increases, what happens to equilibrium o Equilibrium price and quantity increases Created by Maria Mari Fall 2007 Page 15 of 19 ECO 2013 Chapter 3: Demand, Supply, & Market Equilibrium Price Supply New Eq $7 $6 Demand decreases, what happens to equilibrium o Equilibrium price and quantity decreases D2 Demand Price Supply 100 109 New Eq: Price is $7 Supply$6 increases, what happens to and Qequilibrium = 109 o Equilibrium price decreases and quantity $7 increases D2 Price 100 109 D1 S1 S2 New Eq: $5 Supply decreases, what happens Price to isequilibrium Quantity is $5 o Equilibrium price increases and 109. quantity decreases $6 Price New Eq Price = $6 Q100 = 100109 Demand S2 Simultaneous shifts in supply ad demand Supply o the change in equilibrium price and quantity $6 depends on which curve shifts the most $5 o Supply increases, demand decreases Both decrease price Demand Greater drop than one alone 100 109 Quantity Supply increases quantity Demand decreases quantity Created by Maria Mari Fall 2007 Page 16 of 19 ECO 2013 Chapter 3: Demand, Supply, & Market Equilibrium Depend on the relative size of each change o Supply decreases, demand increases Both increase price Greater increase than one alone Quantity Supply decreases quantity Demand increases quantity Depend on the relative size of each change o Supply increases, demand increases Price Demand increases price Supply decreases price If increase in supply is greater than the increase in demand, the equilibrium price will fall. Quantity will increase Supply increases quantity Demand increases quantity Increase by an amount greater than each individually o Supply decreases, demand decreases If the decrease in supply is greater than the decrease in demand, equilibrium price will rise Reverse is true Quantity Supply decreases quantity Demand decreases quantity Greater reduction Created by Maria Mari Fall 2007 Page 17 of 19 ECO 2013 Chapter 3: Demand, Supply, & Market Equilibrium Change in Supply Change in Demand Effect on Equilibrium Price Effect on Equilibrium Quantity Increase Decrease Decrease Indeterminate Decrease Increase Increase Indeterminate Increase Increase Indeterminate Increase Decrease Decrease Indeterminate Decrease Government Intervention in the Economy Government enters into the economy when market failure occurs Two types of intervention o Price setting o Subsidies Government payments to reduce the cost of production or to limit production Agricultural products Price Setting Government sometimes concludes that supply and demand will produce prices that are unfairly high for buyers or unfairly low for sellers So government may place legal limits on how high or low a price or prices may go. Price Floors o A minimum legal price below which a good or service cannot be sold. Created by Maria Mari Fall 2007 Page 18 of 19 ECO 2013 Chapter 3: Demand, Supply, & Market Equilibrium o o o o o Fixed by government A price below is not legal A price above is legal If above equilibrium causes surplus Agricultural goods Price If market in equilibrium at $6 and 100 units. Then gov’t sets price at $8, producers supply 125 units and consumer demands 75 units there is a permanent surplus in the market. Price cannot drop Supply $8 Price Floor $6 $5 Demand 75 100 125 Surplus of 50 units Price Ceiling o A maximum legal price above which a good or service cannot be sold o A price at or below the ceiling is legal o A price above the ceiling is not legal o If above equilibrium causes shortage o Rent control Price Supply $8 $6 Created by Maria Mari Fall 2007 Page 19 of 19 Price Ceiling $5 Demand 8 9 10 If market in equilibrium at $6 and 9 units. Then gov’t sets price at $5, producers supply 8 units and consumer demands 10 units there is a permanent shortage in the market. Price


