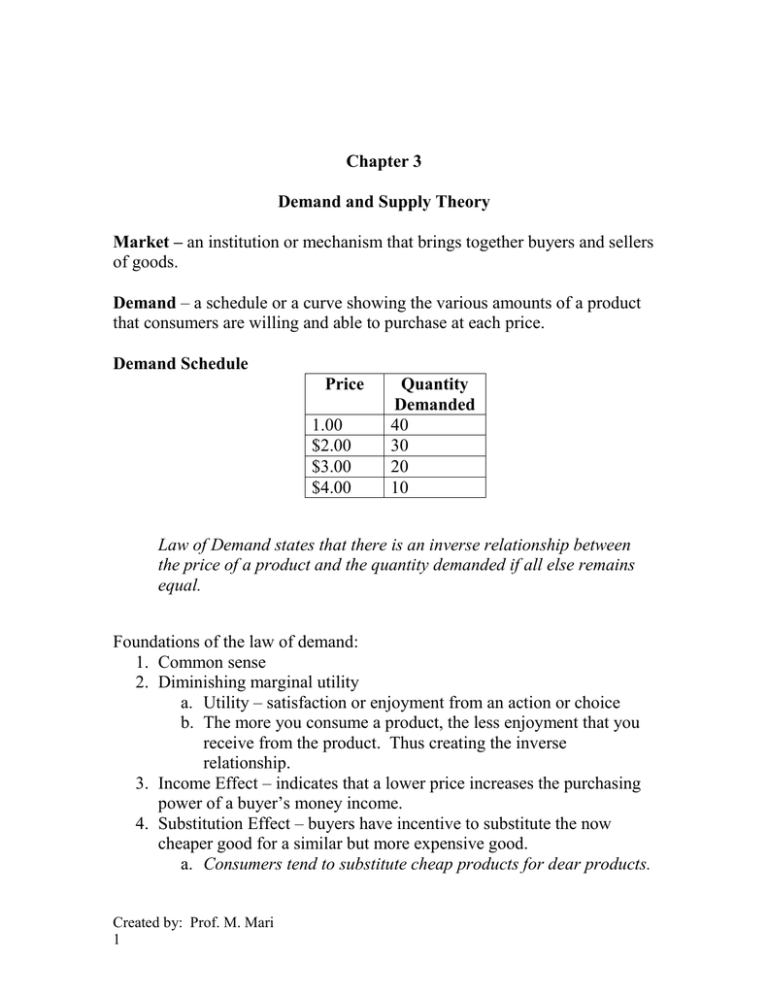
of goods. 1.00
advertisement

Chapter 3 Demand and Supply Theory Market – an institution or mechanism that brings together buyers and sellers of goods. Demand – a schedule or a curve showing the various amounts of a product that consumers are willing and able to purchase at each price. Demand Schedule Price 1.00 $2.00 $3.00 $4.00 Quantity Demanded 40 30 20 10 Law of Demand states that there is an inverse relationship between the price of a product and the quantity demanded if all else remains equal. Foundations of the law of demand: 1. Common sense 2. Diminishing marginal utility a. Utility – satisfaction or enjoyment from an action or choice b. The more you consume a product, the less enjoyment that you receive from the product. Thus creating the inverse relationship. 3. Income Effect – indicates that a lower price increases the purchasing power of a buyer’s money income. 4. Substitution Effect – buyers have incentive to substitute the now cheaper good for a similar but more expensive good. a. Consumers tend to substitute cheap products for dear products. Created by: Prof. M. Mari 1 Demand Curve Price A B Demand curve Quantity 50 75 Notice that as the price increases from $4 to $5, the quantity demanded decreased to 50 units from 75 units. This is the inverse relationship between price and quantity demanded. As we move from point B to A, we call this a movement along the demand curve. Determinants of Demand – assumptions – other things equal Tastes or preferences Number of consumers in the market Income Price in relation to other goods o Substitutes – two goods that are interchangeable If the price of one good increases then the quantity demanded of the other good increases o Complements – two goods that are consumed jointly If the price of one good increases then the quantity demanded of the other complement decreases Expectation of future prices. Created by: Prof. M. Mari 2 Change in Demand - A change in one or more of the determinants of demand will change the demand of a good. Results in a SHIFT IN DEMAND. 1. Increase in demand - At each and every price more of the good is sold - Examples: 1. Income increases 2. Tastes increase 3. Price of related goods a. Complements – the price of one complement decreases b. Substitutes – the price of a substitute increases 4. Expected future prices increase Demand Curve Price P1 A P2 B New demand curve Demand curve Quantity Q1 Q2 At the original price of P1, the quantity of Q1 is sold. After an increase in the demand of the good, at P1, the quantity of Q2 is sold. Created by: Prof. M. Mari 3 2. Decrease in demand - At each and every price less of the good is sold - Examples: 1. Income decreases 2. Tastes decrease 3. Price of related goods a. Complements – the price of one complement increases b. Substitutes – the price of a substitute decreases 4. Expected future prices decrease Demand Curve Price P1 P2 B Demand curve New Demand curve Quantity Q1 Q2 At the original price of P1, the quantity of Q2 is sold. After a decrease in the demand of the good, at P1, the quantity of Q1 is sold. Change in the quantity demanded – Caused by a change in price and only in the price of the good. Results in a movement along the curve. Created by: Prof. M. Mari 4 Supply - shows the amounts of a product that a producer is willing and able to produce and make available for sale at each price. Price $1.00 $2.00 $3.00 $4.00 Quantity Supplied 100 200 300 400 Law of Supply – states that there is a direct relationship between the price of a good and the quantity supplied as long as other things remain constant. As the price rises, the quantity supplied rises As the price falls, the quantity supplied falls Quantity Q1 Q2 Determinants of Supply – other factors that affect supply Resource prices Technology Taxes and subsidies Price of other goods – substitution in production for more profitable goods Price expectations Political and natural causes Created by: Prof. M. Mari 5 Change in one or more of these changes then there are a SHIFT IN SUPPLY. 1. Increase in Supply – at each and every price more of the good is available for sale. Resource prices will decrease Technology is better Taxes decrease or subsidies increase Price of other goods decrease Price Supply New Supply P1 Quantity Q1 Q2 At price P1, the original supply curve has a quantity of Q1 but with an increase in supply, quantity increases to Q2. 2. Decrease in Supply – at each and every price less of the good is available for sale. Resource prices will increase Taxes increase Subsidies decrease Price of other goods increase Price Supply New Supply P1 Quantity Created by: Prof. M. Mari 6 Q1 Q2 Change in Quantity Supplied A change in the price of a good and only the price of the good results in a movement along the supply curve. Market Equilibrium The point where the market demands equals the market supply. Supply P1 PE P2 Demand QE Surplus: At P1, the price leads to a quantity demanded which is less than the quantity supplied. Producers are left with excess product to dispose of. They lower the price of the product and continue to lower the price until the Quantity demanded equals the Quantity supplied. Shortage: At P2, the prices leads to a quantity demanded which is greater than the quantity supplied. Consumers are left wanting a product that does not exist on the shelves. They bid up the price to get their product. The price continues to rise until the Quantity demanded equals the quantity supplied. Equilibrium - a price where the quantity supplied = the quantity demanded. It is natural for the market to always move toward equilibrium. Created by: Prof. M. Mari 7 Capitalist Ideology – defined by Private property Freedom of enterprise and choice o Private business are free to obtain economic resources to organize those resources in the production of goods and services of the firm’s own choosing and sell them in markets of their choice. o Choice – owners employ or dispose of their property and money as they see fit. o Consumer choice in a capitalist economy is perhaps the most profound of these freedoms. Self interest as dominant o Driving force of capitalism. o Individuals maximize their utility Competition o Freedom of choice exercised in promotion of one’s own monetary returns is the basis for competition. o Requires Large number of independent buyers and sellers Freedom of entry or exit Reliance on market system o Market and prices are the coordinating mechanism of a capitalist economy. A limited role for government Other characteristics o Extensive use of technology and capital goods. Opportunity and motivation for such in competition o Specialization Majority of consumers produce virtually none of the goods and services they consume Majority of consumers consume little or nothing that they produce Division of labor – human specialization enhances society’s output by Making use of ability differences Allows learning by doing Saves time o Use of money Created by: Prof. M. Mari 8 Medium of exchange Five fundamental questions of Competitive Market System 1. How much of a society’s resources should be used? 2. What is to be produced? a. Economic costs are payments which must be made to secure and retain the needed amounts of these resources b. Normal profit – Total revenue – Total cost – Payments for contribution of entrepreneur c. Economic profit – above normal profit i. Occurs in expanding industries ii. New firms enter the industry at this sign 3. How is the quantity produced? 4. Who receives the quantity? 5. Can the system adapt to change? Created by: Prof. M. Mari 9


