SRP 10 –How to do “T test”
advertisement

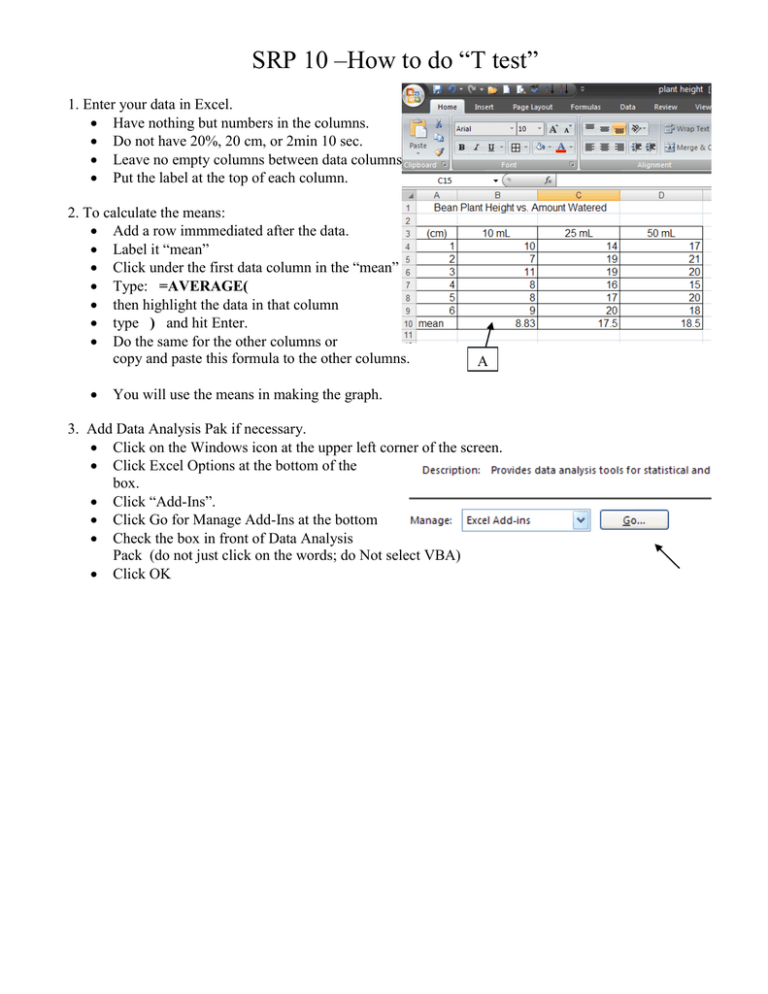
SRP 10 –How to do “T test” 1. Enter your data in Excel. Have nothing but numbers in the columns. Do not have 20%, 20 cm, or 2min 10 sec. Leave no empty columns between data columns. Put the label at the top of each column. 2. To calculate the means: Add a row immmediated after the data. Label it “mean” Click under the first data column in the “mean” row. (A) Type: =AVERAGE( then highlight the data in that column type ) and hit Enter. Do the same for the other columns or copy and paste this formula to the other columns. You will use the means in making the graph. A . 3. Add Data Analysis Pak if necessary. Click on the Windows icon at the upper left corner of the screen. Click Excel Options at the bottom of the box. Click “Add-Ins”. Click Go for Manage Add-Ins at the bottom Check the box in front of Data Analysis Pack (do not just click on the words; do Not select VBA) Click OK 4. Performing t-test Select Data from the ribbon Select Data Analysis at the far right part of the ribbon Select t-test: Two sample assuming equal variance, click OK A A Click the first chart icon (A) Highlight the data from the experimental group starting with the label. Click the icon again. Click the second chart icon (B) B Highlight the data from the control group starting with the label. Click the icon again. Hypothesized mean difference = 0 Check the box for Labels B D C This is important: Select Output Range by clicking the circle C Click on the Output Range chart icon D Select a cell where you want the t-test to be displayed. You mush click on a cell or Excel will place the table over your data, erasing your data, and the undo button will not work to restore your data. Click OK Excel will place the statistics table on your spreadsheet. Repeat for each experimental data column. Interpretation of the statistics table. This is the table that will go into your paper and on your board. The raw data table does NOT go in the paper or on your board. The arithmetic mean and variance are given to you. The t Stat is the t statistic. You really don’t need this, because it is used to look up in a t-test table to determine the P value. But they give you the P value in the table. You need to look at the two-tailed P value. This means that you care about values higher or lower than your control group’s mean. One tailed would be used if we cared only about values that were higher (or only values that were lower) than the control mean. Please use the two-tailed values. Note that this P value is 1.35103E-05. This means 1. 35103 x 10-5. This is a very small number and certainly < 0.05. This means that the mean of this experimental group is significantly different than the mean of the control group. We can reject the null hypothesis (that the experimental and control groups are the same) and support the alternative hypothesis (your hypothesis in your paper). You do not need to use all of those digits when referring to the P value in your paper. Just 2 decimal numbers is plenty 1.25103E-05 becomes 1.25E-05.
