Monster Graphing
advertisement
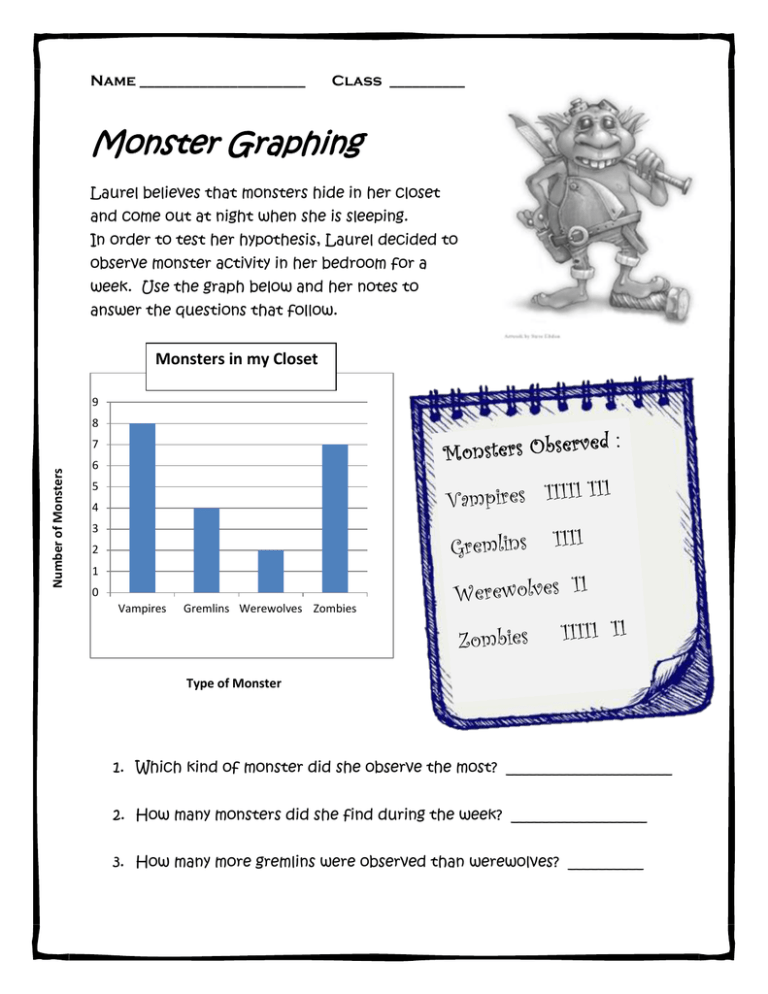
Name ______________________ Class __________ Monster Graphing Laurel believes that monsters hide in her closet and come out at night when she is sleeping. In order to test her hypothesis, Laurel decided to observe monster activity in her bedroom for a week. Use the graph below and her notes to answer the questions that follow. Monsters in my Closet 9 8 Number of Monsters 7 6 5 4 3 2 1 0 Vampires Gremlins Werewolves Zombies Type of Monster 1. Which kind of monster did she observe the most? ______________________ 2. How many monsters did she find during the week? __________________ 3. How many more gremlins were observed than werewolves? __________ Let’s Make a Graph! Use the data below to create your own bar graph. Label the title, independent variable, and dependent variable. Use colored pencils to complete the graph. _________________________________ DV: _________________________________ Title: IV: ____________________________________
