Statistics Review Name __________________________ HW – Intro to Statistics
advertisement
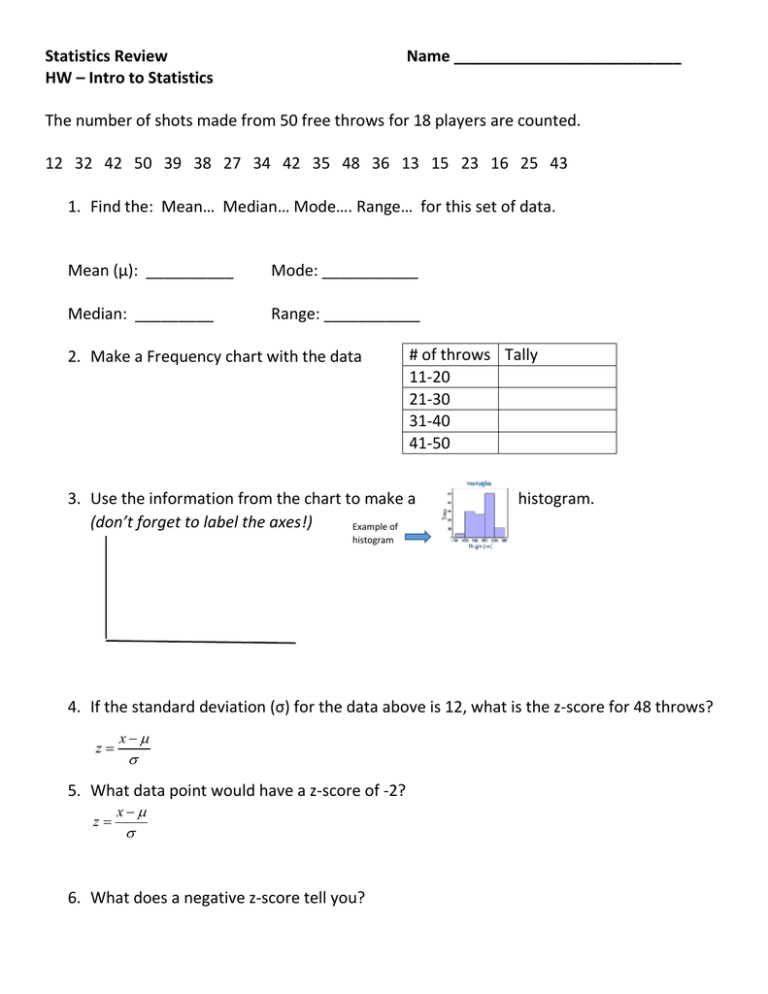
Statistics Review HW – Intro to Statistics Name __________________________ The number of shots made from 50 free throws for 18 players are counted. 12 32 42 50 39 38 27 34 42 35 48 36 13 15 23 16 25 43 1. Find the: Mean… Median… Mode…. Range… for this set of data. Mean (µ): __________ Mode: ___________ Median: _________ Range: ___________ 2. Make a Frequency chart with the data # of throws Tally 11-20 21-30 31-40 41-50 3. Use the information from the chart to make a (don’t forget to label the axes!) Example of histogram. histogram 4. If the standard deviation (σ) for the data above is 12, what is the z-score for 48 throws? z x 5. What data point would have a z-score of -2? z x 6. What does a negative z-score tell you?
