Supplemental Table 1. Crystallographic statistics
advertisement
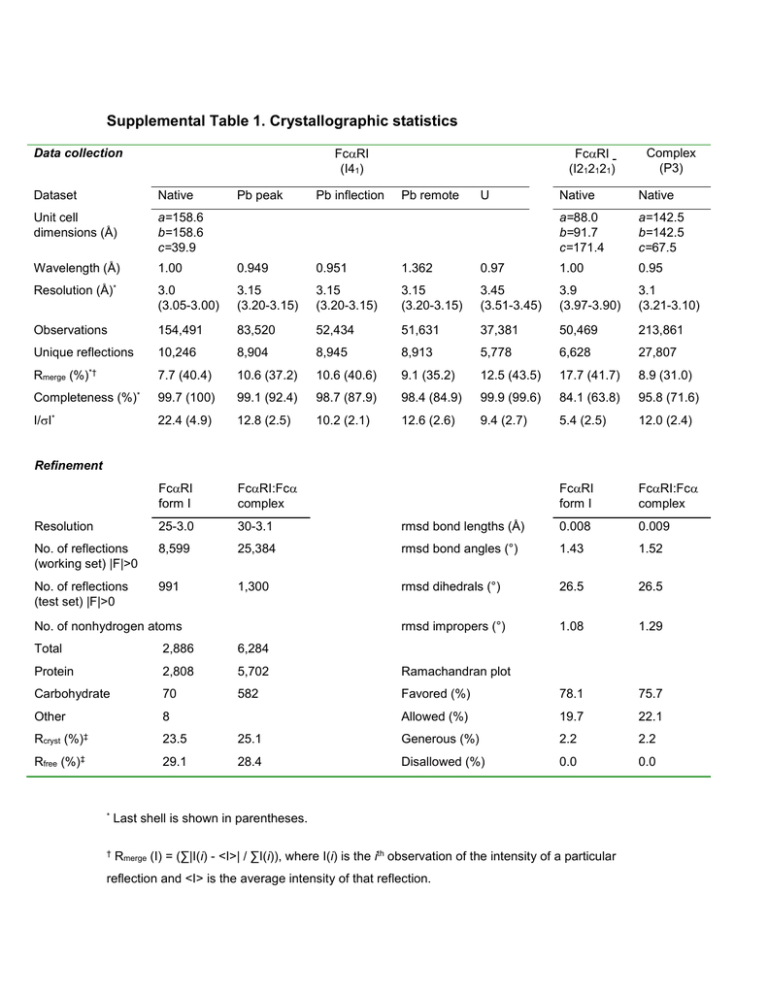
Supplemental Table 1. Crystallographic statistics Data collection FcRI (I41) Dataset Native Native Unit cell dimensions (Å) a=158.6 b=158.6 c=39.9 a=88.0 b=91.7 c=171.4 a=142.5 b=142.5 c=67.5 Wavelength (Å) 1.00 0.949 0.951 1.362 0.97 1.00 0.95 3.0 (3.05-3.00) 3.15 (3.20-3.15) 3.15 (3.20-3.15) 3.15 (3.20-3.15) 3.45 (3.51-3.45) 3.9 (3.97-3.90) 3.1 (3.21-3.10) Observations 154,491 83,520 52,434 51,631 37,381 50,469 213,861 Unique reflections 10,246 8,904 8,945 8,913 5,778 6,628 27,807 7.7 (40.4) 10.6 (37.2) 10.6 (40.6) 9.1 (35.2) 12.5 (43.5) 17.7 (41.7) 8.9 (31.0) Completeness (%)* 99.7 (100) 99.1 (92.4) 98.7 (87.9) 98.4 (84.9) 99.9 (99.6) 84.1 (63.8) 95.8 (71.6) I/I* 22.4 (4.9) 12.8 (2.5) 10.2 (2.1) 12.6 (2.6) 9.4 (2.7) 5.4 (2.5) 12.0 (2.4) FcRI form I FcRI:Fc complex FcRI form I FcRI:Fc complex Resolution 25-3.0 30-3.1 rmsd bond lengths (Å) 0.008 0.009 No. of reflections (working set) |F|>0 8,599 25,384 rmsd bond angles (°) 1.43 1.52 No. of reflections (test set) |F|>0 991 1,300 rmsd dihedrals (°) 26.5 26.5 rmsd impropers (°) 1.08 1.29 Resolution Rmerge (%)*† Pb inflection Pb remote U Complex (P3) Native (Å)* Pb peak FcRI (I212121) Refinement No. of nonhydrogen atoms Total 2,886 6,284 Protein 2,808 5,702 Ramachandran plot Carbohydrate 70 582 Favored (%) 78.1 75.7 Other 8 Allowed (%) 19.7 22.1 Rcryst (%)‡ 23.5 25.1 Generous (%) 2.2 2.2 (%)‡ 29.1 28.4 Disallowed (%) 0.0 0.0 Rfree * Last shell is shown in parentheses. † Rmerge (I) = (∑|I(i) - <I>| / ∑I(i)), where I(i) is the ith observation of the intensity of a particular reflection and <I> is the average intensity of that reflection. ‡ Rcryst (F) = ∑||Fobs| - |Fcalc|| / ∑|Fobs|, where Fobs and Fcalc are the observed and calculated structure factor amplitudes, respectively. Rfree was calculated for a test set containing randomly chosen reflections that were not included in the refinement. Supplemental Table 2. RMS deviations between FcRI or Fc and related proteins FcRI D1 D2 Fc C2 C3 LIR-11 rmsd (Å) 1.73 (69)a 1.57 (78) KIR2 rmsd (Å) 1.74 (72) 1.23 (87) FcRIIa3 rmsd (Å) 1.53 (64) 1.33 (66) Fc7 rmsd (Å) 1.42 (88) 0.94 (100) Fc3-48 rmsd (Å) 1.38 (84) 1.15 (90) Fc2-49 rmsd (Å) 1.45 (89) 1.18 (92) FcRIIb4 rmsd (Å) 1.73 (64) 1.28 (66) FcRIII5 rmsd (Å) 1.44 (62) 1.31 (72) FcRI6 rmsd (Å) 1.72 (64) 1.46 (79) Rms deviations between domains were calculated using LSQMAN 10. a Values in parentheses are the number of C atoms used in the calculation. Supplemental Table 3. Pairwise interactions in the FcRI:Fc interfacea FcRI residue Tyr-35 % ASA (Å2) 7 Arg-52 Arg-53 Leu-54 6 3 16 Lys-55 9 Phe-56 10 Mutation (effect on affinity)b Y35A, 100x R52A, 8x R53A, no effect Trp-57 Arg-82 3 5 R82A, ablation; R82G, ablationd Gly-84 5 G84A, 19x His-85 16 H85A, 4x ; H85E, ablationd Man-923 (Asn-58) Man-927 (Asn-58) a 4 10 Fc residue Leu-257 Leu-258 Phe-443 Leu-258 Ser-387 Leu-258 Arg-382 Leu-384 Glu-389 Met-433 Ser-387 Met-433 Gln-445 Met-433 Leu-441 Phe-443 Gln-445 Ser-387 Leu-256 Leu-257 Pro-440 Leu-441 % ASA (Å2) 8 10 5 Mutation (effect on binding)c L257R, ablation L258R, ablatione F443R, ablation L258R, ablation 10 L258R, ablatione 1 3 5 6 6 12 LA441-442MN, ablation; L441R, ablatione F443R, ablation 3 8 Ala-442 Leu-257 His-436 Glu-437 Ala-438 Leu-439 Ala-442 Pro-440 4 Glu-348 Thr-444 7 3 L257R, ablation P440A, ablation; P440R, 10x LA441-442MN, ablation; L441R, ablatione A442R, ablation L257R, ablation 1 2 0 1 A442R, ablation P440A, ablation; P440R, 10x Pairwise interactions in the FcRI:Fc interface between any nonhydrogen atoms within 4 Å were determined using CNS11. b From 12; affinities determined by biosensor binding studies, except where noted. c From 13; binding determined by rosetting assay, except where noted. d From14; affinities determined by gel shift assay e From 15; binding determined by rosetting assay. References 1. 2. 3. 4. 5. 6. 7. 8. 9. 10. 11. 12. 13. 14. 15. Chapman, T. L., Heikema, A. P., West, A. P. & Bjorkman, P. J. Crystal structure and ligand binding properties of the D1D2 region of the inhibitory receptor LIR-1 (ILT2). Immunity 13, 727-36. (2000). Fan, Q. R. et al. Structure of the inhibitory receptor for human natural killer cells resembles haematopoietic receptors. Nature 389, 96-100. (1997). Maxwell, K. F. et al. Crystal structure of the human leukocyte Fc receptor, FcRIIa. Nat Struct Biol 6, 437-42. (1999). Sondermann, P. & Jacob, U. Human Fc receptor IIb expressed in Escherichia coli reveals IgG binding capability. Biol Chem 380, 717-21. (1999). Sondermann, P., Huber, R., Oosthuizen, V. & Jacob, U. The 3.2-A crystal structure of the human IgG1 Fc fragment-FcRIII complex. Nature 406, 267-73. (2000). Garman, S. C., Kinet, J. P. & Jardetzky, T. S. Crystal structure of the human high-affinity IgE receptor. Cell 95, 951-61. (1998). DeLano, W. L., Ultsch, M. H., de Vos, A. M. & Wells, J. A. Convergent solutions to binding at a protein-protein interface. Science 287, 1279-83. (2000). Wurzburg, B. A., Garman, S. C. & Jardetzky, T. S. Structure of the human IgE-Fc C3-C4 reveals conformational flexibility in the antibody effector domains. Immunity 13, 375-85. (2000). Wan, T. et al. The crystal structure of IgE Fc reveals an asymmetrically bent conformation. Nat Immunol 3, 681-6. (2002). Jones, T. A. & Kjeldgaard, M. Electron density map interpretation. Methods Enzymol 277, 173-208 (1997). Brunger, A. T. et al. Crystallography & NMR system: A new software suite for macromolecular structure determination. Acta Crystallogr D Biol Crystallogr 54, 905-21. (1998). Wines, B. D., Sardjono, C. T., Trist, H. M., Lay, C. S. & Hogarth, P. M. The interaction of FcRI with IgA and its implications for ligand binding by immunoreceptors of the leukocyte receptor cluster. J Immunol 166, 1781-1789 (2001). Pleass, R. J., Dunlop, J. I., Anderson, C. M. & Woof, J. M. Identification of residues in the CH2/CH3 domain interface of IgA essential for interaction with the human fca receptor (FcR) CD89. J Biol Chem 274, 23508-14. (1999). Wines, B. D. et al. Identification of residues in the first domain of human Fc receptor essential for interaction with IgA. J Immunol 162, 2146-53. (1999). Carayannopoulos, L., Hexham, J. M. & Capra, J. D. Localization of the binding site for the monocyte immunoglobulin (Ig) A- Fc receptor (CD89) to the domain boundary between C2 and C3 in human IgA1. J Exp Med 183, 1579-86 (1996).
