HCI-AOS Statistics Module 2010 BASIC STATISTICS HOMEWORK 1 Description of data
advertisement

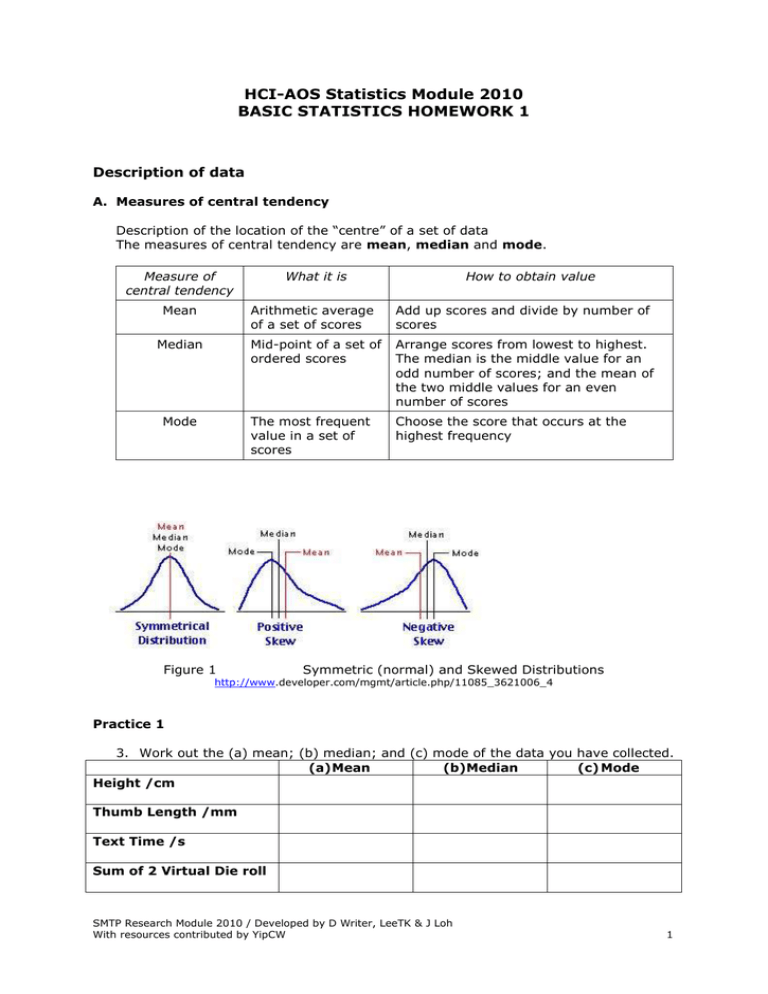
HCI-AOS Statistics Module 2010 BASIC STATISTICS HOMEWORK 1 Description of data A. Measures of central tendency Description of the location of the “centre” of a set of data The measures of central tendency are mean, median and mode. Measure of central tendency Mean Median Mode What it is How to obtain value Arithmetic average of a set of scores Add up scores and divide by number of scores Mid-point of a set of ordered scores Arrange scores from lowest to highest. The median is the middle value for an odd number of scores; and the mean of the two middle values for an even number of scores The most frequent value in a set of scores Choose the score that occurs at the highest frequency Figure 1 Symmetric (normal) and Skewed Distributions http://www.developer.com/mgmt/article.php/11085_3621006_4 Practice 1 3. Work out the (a) mean; (b) median; and (c) mode of the data you have collected. (a) Mean (b)Median (c) Mode Height /cm Thumb Length /mm Text Time /s Sum of 2 Virtual Die roll SMTP Research Module 2010 / Developed by D Writer, LeeTK & J Loh With resources contributed by YipCW 1 3. Microsoft Excel: Step by Step The following is an example of how to find the mean, mode and median using MS Excel. Enter the numbers in cells A2 to A16: 104, 104, 104, 104, 104, 107, 109, 109, 109, 110, 109, 111, 112, 111, 109 For the mean, enter =AVERAGE(A2:A16) in a blank cell. For the mode, enter =MODE(A2:A16) in a blank cell. For the median, enter =MEDIAN(A2:A16) in a blank cell. Figure 2 – Example of data entry Perform the same operations using the data you have collected in MS Excel. SMTP Research Module 2010 / Developed by D Writer, LeeTK & J Loh With resources contributed by YipCW 2 B. Measures of spread of data The standard deviation is a measure of the spread of data about their mean. According to the Rounding Rule for the Standard Deviation, the final answer should be rounded to one more decimal place than that of the original data. If the distribution About 68% of About 95% of About 99% of of the data is symmetric, then the following rules apply: all scores fall between the mean () and 1 standard deviation (). all scores fall between the mean and 2 standard deviations. all scores fall between the mean and 3 standard deviations. Figure 3 – Interpretation of standard deviation on a normal distribution http://www.answers.com/topic/normal-distribution Practice 2 1. Using MS Excel to compute standard deviation Example (Refer to Figure 4) Enter the numbers in a range A2:A7. For the sample standard deviation, enter in a blank cell =STDEV(A2:A7). Figure 4 – Example of data entry and finding standard deviation 2. Use MS Excel to find the standard deviation for the data you have collected in the table below. 2a. Using the standard deviation that you have computed, measure the percentage of data points that fall within 1,2 and 3 standard deviations from the mean values. Record these percentages in your data table. SMTP Research Module 2010 / Developed by D Writer, LeeTK & J Loh With resources contributed by YipCW 3 Standard Deviation (SD) % of data within 1 SD from mean % of data within 2 SD from mean % of data within 3 SD from mean Height /cm Thumb Length /mm Text Time /s Sum of 2 Virtual Die roll 2b. Compare your percentage of data points within 1 standard deviation to percentage in Figure 3. Do likewise for 2 and 3 standard deviations. 2c. How would you be able to make your percentage of data within 1 standard deviation closer to the model in Figure 3? SMTP Research Module 2010 / Developed by D Writer, LeeTK & J Loh With resources contributed by YipCW 4


