Pendulum Laboratory
advertisement

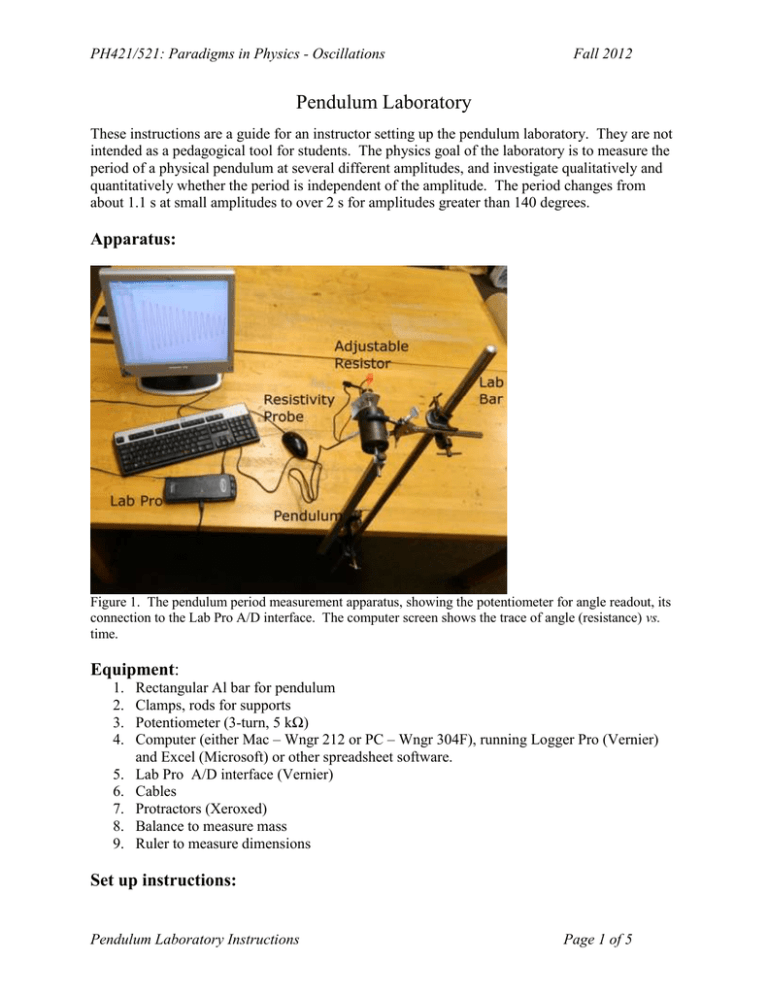
PH421/521: Paradigms in Physics - Oscillations Fall 2012 Pendulum Laboratory These instructions are a guide for an instructor setting up the pendulum laboratory. They are not intended as a pedagogical tool for students. The physics goal of the laboratory is to measure the period of a physical pendulum at several different amplitudes, and investigate qualitatively and quantitatively whether the period is independent of the amplitude. The period changes from about 1.1 s at small amplitudes to over 2 s for amplitudes greater than 140 degrees. Apparatus: Figure 1. The pendulum period measurement apparatus, showing the potentiometer for angle readout, its connection to the Lab Pro A/D interface. The computer screen shows the trace of angle (resistance) vs. time. Equipment: 1. 2. 3. 4. 5. 6. 7. 8. 9. Rectangular Al bar for pendulum Clamps, rods for supports Potentiometer (3-turn, 5 kΩ) Computer (either Mac – Wngr 212 or PC – Wngr 304F), running Logger Pro (Vernier) and Excel (Microsoft) or other spreadsheet software. Lab Pro A/D interface (Vernier) Cables Protractors (Xeroxed) Balance to measure mass Ruler to measure dimensions Set up instructions: Pendulum Laboratory Instructions Page 1 of 5 PH421/521: Paradigms in Physics - Oscillations Fall 2012 The pendulum is an aluminum bar with a hole drilled near top (give dimensions, mass, I). The shaft of a potentiometer fits through this hole and the pendulum is clamped to it with a set screw. The potentiometer is clamped to a support bar, which in turn is clamped to the table. Mount the pendulum fulcrum as close to table as possible. The pendulum also has a knurled nut that holds a sturdy wire – this is to better judge deviation from vertical. The computer runs Logger Pro (Vernier Software) with addition of ohmmeter sensor software (We use the resistivity to measure the angle of the pendulum. Since Vernier’s Logger Pro software cannot measure resistance, we built our own resistivity probe and configured the software to detect and read the probe . The instructions can be found here: http://web.pdx.edu/~d4eb/ohmmeter/TPT_2004_vol_42_435.pdf) Logger Pro Troubleshooting: We use a resistivity probe to measure the voltage across the variable resistor. If Logger Pro is does not find the probe, go to the menu: Experiment => Set up Sensor => Show All Interfaces and choose “ohmmeter”, as shown in Fig. 2. Figure 2 (a) and (b) How to configure the resistivity probe in Logger Pro. Lab Pro is the interface between the computer and the potentiometer. It has not been installed on every USB port on the computer. If the USB port does not recognize Lab Pro, plug the connector into another USB port. If the computer still does not recognize Lab Pro, an administrator needs to install the Lab Pro to that port manually. To adjust the sampling rate for the experiment, go to the menu: Experiment => Data Collection => Sampling Rate and choose the desired sampling rate. A protractor (or xeroxed copy of a protractor) is available at each workstation to measure the starting angle of the pendulum, so as to calibrate the voltage output. One balance and a ruler (or a few) are available to the class to measure physical properties of the pendulum. Pendulum Laboratory Instructions Page 2 of 5 PH421/521: Paradigms in Physics - Oscillations Fall 2012 Operating instructions: Hold the pendulum at various angles and record the corresponding voltage registered by the data acquisition system. Record both positive and negative voltages and record large and small angles. By convention, 0 deg corresponds to the pendulum hanging vertically, and positive displacement is CCW rotation as you face the pendulum. Important: Set the potentiometer in the middle of its range for the students’ first encounter. Warn them that the total range is 3 turns and that forcing the pendulum beyond that will destroy the potentiometer. (This is really the only place where students need a warning because it is not fun to replace potentiometers mid-lab.) All other errors are non-fatal, and students should be allowed to make them. Students must learn that calibration should cover the complete range of measurement. It is not strictly necessary to convert measured voltages to angular displacements immediately because most of the experiment can be done without this, but it must be done for final presentation of results. However, best if students do the analysis quickly in Excel to see that it’s sensible. Record the motion of the pendulum so that the period can be measured for a range of angles, including small angles (< 5 degrees) and very large ones (> 150 degrees). One way is to record just one trace, starting from a large angle and the damping automatically ensures that the amplitudes are varied. Another way is to record several traces of just a few cycle each, starting from different amplitudes. Either way, (i) there must be enough resolution to be able to define the zero crossings well – i.e. a large enough number of points per cycle and (ii) the amplitude MUST be calculated from the data and NOT the starting amplitude as recorded by the protractor (this is a very common mistake!) The more rigid the system, the better – otherwise there is excessive energy loss. The period is about 1.1 s at small angles and is larger than 2 s at high angles. A 10 ms time resolution therefore gives about 100 points per cycle at the shortest period and 200 per cycle at the longest. This is the minimum resolution needed. More resolution results in larger files, but better results. Students should take at least one long-time trace of a small angle oscillation to see damping – they analyze this in class separately. Try to get better time resolution than 10 ms. Students are to measure mass and dimensions of pendulum to get moment of inertia, and hence predict the small angle period. Analysis: The graphical display and cursors in Logger Pro are sufficient to determine the period of the motion. Zero crossing points are better than maxima because the function changes fastest there (discuss with students). Logger Pro has the amplitude in voltage units, not degrees or radians. For sensible presentation, it is critical that the conversion be made. Students must find average of the function, and rescale data to have zero as the average. Pendulum Laboratory Instructions Page 3 of 5 PH421/521: Paradigms in Physics - Oscillations Fall 2012 Check that the voltage to angle conversion is indeed linear (it is), but discuss with the students the fact that, even if it is not, calibration over the full range allows accurate conversion. Plot the period as a function of amplitude in degrees. Plot the motion for large, intermediate and small angles on the same axes, moving the plots as necessary to have them correspond in starting phase (e.g., zero and going positive). The increase in period is nicely evident in a qualitative way. Calculate small angle period of plane pendulum for this pendulum from moment of inertia and length. Complete period analysis worksheet that uses a power series expansion to simplify integral for calculating period, or do the exact integral on Mathematica. Typical problems encountered: Failure to record motion at large enough angles. This is the most important error and severely limits the change in period, and results in an unsatisfying experience. Make sure everyone has motion recorded for the largest possible angle. Because the damping is severe, students need to start recording within the first cycle. Failure to calibrate over a large range of angles. In practice, this doesn’t cause trouble in this experiment because of the linearity of the voltage/resistance conversion, but the students don’t know this at the outset, so they should think about it. Insufficient time resolution for each cycle (and insufficient voltage resolution). Sloppy recording of the experiment. Many students jot down obscure notes, and do not have a sense of order or purpose as they record. Tables are not properly labeled. The juxtaposition of paper and electronic recording also presents problems. Ask students to pay attention to their notes. In the analysis, many students assert that the period change is caused by the damping. They usually argue that the pendulum “slows down” because it loses energy and therefore the period is shorter. In fact, the damping is not the direct cause. It certainly causes the amplitude to decrease, and the period then decreases. But it is the non-Hooke’s law part of the force that is responsible for the change, not the damping per se. If a Hookean spring were used as the oscillator instead, the damping would not cause such a period change! Students should be encouraged to be very clear about each step in the reasoning. For example, the connection between lower energy and shorter period is NOT obvious (it’s the object of the investigation!) It happens to be true for the pendulum, but it is NOT true for a purely harmonic spring, for example, where the period is independent of the energy. This experiment is a great vehicle for discussion and can be used to show the utility of energy diagrams. Ask questions about more energy => higher velocity => shorter time, but more energy => larger amplitude => larger distance => longer time. Suggest measuring just a half cycle where the damping is not so severe. Pendulum Laboratory Instructions Page 4 of 5 PH421/521: Paradigms in Physics - Oscillations Pendulum Laboratory Instructions Fall 2012 Page 5 of 5


