GLACIER FILES AND INFORMATION FOR UNIVERSITY OF OREGON’S ENVIRONMENTAL
advertisement

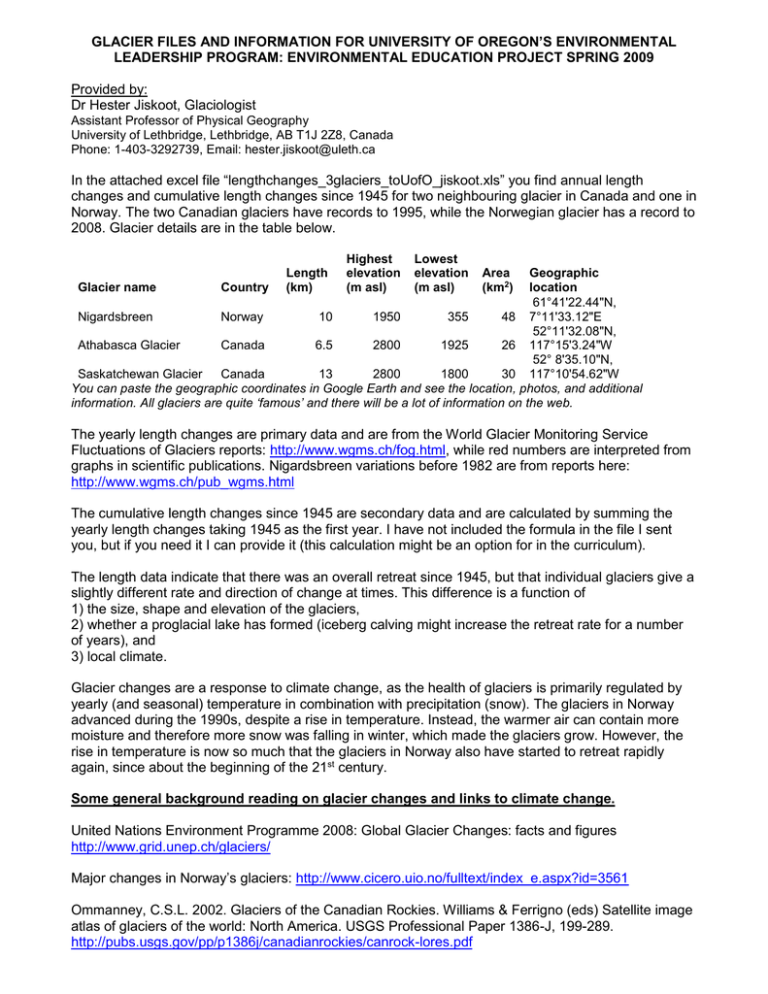
GLACIER FILES AND INFORMATION FOR UNIVERSITY OF OREGON’S ENVIRONMENTAL LEADERSHIP PROGRAM: ENVIRONMENTAL EDUCATION PROJECT SPRING 2009 Provided by: Dr Hester Jiskoot, Glaciologist Assistant Professor of Physical Geography University of Lethbridge, Lethbridge, AB T1J 2Z8, Canada Phone: 1-403-3292739, Email: hester.jiskoot@uleth.ca In the attached excel file “lengthchanges_3glaciers_toUofO_jiskoot.xls” you find annual length changes and cumulative length changes since 1945 for two neighbouring glacier in Canada and one in Norway. The two Canadian glaciers have records to 1995, while the Norwegian glacier has a record to 2008. Glacier details are in the table below. Highest elevation (m asl) Lowest elevation (m asl) Geographic location 61°41'22.44"N, Nigardsbreen Norway 10 1950 355 48 7°11'33.12"E 52°11'32.08"N, Athabasca Glacier Canada 6.5 2800 1925 26 117°15'3.24"W 52° 8'35.10"N, Saskatchewan Glacier Canada 13 2800 1800 30 117°10'54.62"W You can paste the geographic coordinates in Google Earth and see the location, photos, and additional information. All glaciers are quite ‘famous’ and there will be a lot of information on the web. Glacier name Country Length (km) Area (km2) The yearly length changes are primary data and are from the World Glacier Monitoring Service Fluctuations of Glaciers reports: http://www.wgms.ch/fog.html, while red numbers are interpreted from graphs in scientific publications. Nigardsbreen variations before 1982 are from reports here: http://www.wgms.ch/pub_wgms.html The cumulative length changes since 1945 are secondary data and are calculated by summing the yearly length changes taking 1945 as the first year. I have not included the formula in the file I sent you, but if you need it I can provide it (this calculation might be an option for in the curriculum). The length data indicate that there was an overall retreat since 1945, but that individual glaciers give a slightly different rate and direction of change at times. This difference is a function of 1) the size, shape and elevation of the glaciers, 2) whether a proglacial lake has formed (iceberg calving might increase the retreat rate for a number of years), and 3) local climate. Glacier changes are a response to climate change, as the health of glaciers is primarily regulated by yearly (and seasonal) temperature in combination with precipitation (snow). The glaciers in Norway advanced during the 1990s, despite a rise in temperature. Instead, the warmer air can contain more moisture and therefore more snow was falling in winter, which made the glaciers grow. However, the rise in temperature is now so much that the glaciers in Norway also have started to retreat rapidly again, since about the beginning of the 21st century. Some general background reading on glacier changes and links to climate change. United Nations Environment Programme 2008: Global Glacier Changes: facts and figures http://www.grid.unep.ch/glaciers/ Major changes in Norway’s glaciers: http://www.cicero.uio.no/fulltext/index_e.aspx?id=3561 Ommanney, C.S.L. 2002. Glaciers of the Canadian Rockies. Williams & Ferrigno (eds) Satellite image atlas of glaciers of the world: North America. USGS Professional Paper 1386-J, 199-289. http://pubs.usgs.gov/pp/p1386j/canadianrockies/canrock-lores.pdf


