SD MS
advertisement

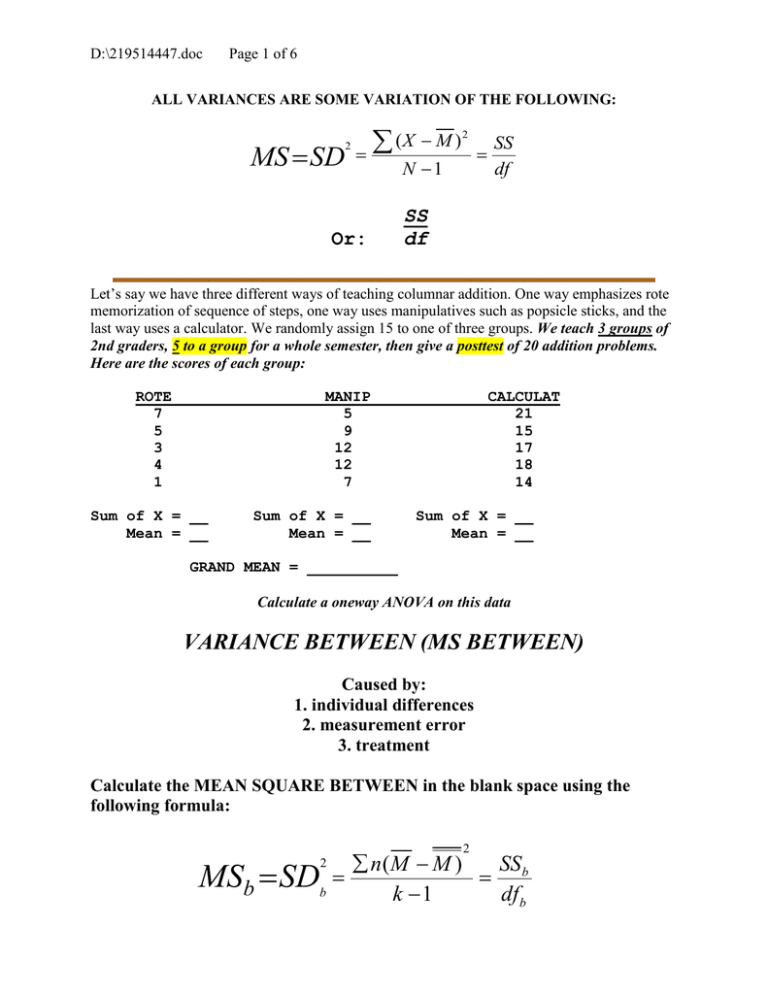
D:\219514447.doc Page 1 of 6 ALL VARIANCES ARE SOME VARIATION OF THE FOLLOWING: MS SD 2 (X M ) 2 N 1 Or: SS df SS df Let’s say we have three different ways of teaching columnar addition. One way emphasizes rote memorization of sequence of steps, one way uses manipulatives such as popsicle sticks, and the last way uses a calculator. We randomly assign 15 to one of three groups. We teach 3 groups of 2nd graders, 5 to a group for a whole semester, then give a posttest of 20 addition problems. Here are the scores of each group: ROTE 7 5 3 4 1 MANIP 5 9 12 12 7 Sum of X = __ Mean = __ Sum of X = __ Mean = __ CALCULAT 21 15 17 18 14 Sum of X = __ Mean = __ GRAND MEAN = __________ Calculate a oneway ANOVA on this data VARIANCE BETWEEN (MS BETWEEN) Caused by: 1. individual differences 2. measurement error 3. treatment Calculate the MEAN SQUARE BETWEEN in the blank space using the following formula: MSb SD 2 2 b n( M M ) SS b k 1 df b D:\219514447.doc Page 2 of 6 Now, fill in the following blanks: SUM OF SQUARES BETWEEN = __________ DEGREES OF FREEDOM BETWEEN = __________ MEAN SQUARE BETWEEN = __________ Now, calculate the MEAN SQUARE WITHIN in the blank space using the following formula: VARIANCE WITHIN (MS WITHIN) Caused by: 1. individual differences 2. measurement error ( X M ) SDw (n 1) 2 2 D:\219514447.doc Page 3 of 6 Now, fill in the following blanks: SUM OF SQUARES WITHIN = __________ DEGREES OF FREEDOM WITHIN = __________ MEAN SQUARE WITHIN = __________ The above are all that is needed to calculate the ANOVA, but the SS Total and df Total are calculated to check our arithmetic. We don’t finish the equation for total variance by dividing the SS Total by the df Total, however. We stop when we have the SS Total and the df Total, because the SS between plus the SS Within should equal the SS Total. And, the df between plus the df within should equal the df Total. TOTAL VARIANCE (MS TOTAL) Not actually calculated. Use the blank space below but stop with numerator (SS Total) and denominator (df Total) SD 2 t 2 ( X M ) N 1 Now, fill in the following blanks: SUM OF SQUARES TOTAL = __________ DEGREES OF FREEDOM TOTAL = __________ MEAN SQUARE TOTAL = NOT CALCULATED D:\219514447.doc Page 4 of 6 Now, you have everything you need to calculate the F statistic: MS b F MS w Calculate the F for this ANOVA in the following space: F = __________ Now, since you are doing this by hand, you must enter an F table with the degrees of freedom for the numerator of the equation for F and the degrees of freedom for the denominator of the equation for F. The df for the numerator (MS between) is ______. The df for the denominator (MS within) is ______. Here is a small section of an F table. The upper number is the .05 level, the lower number the .01 level: D:\219514447.doc Page 5 of 6 The critical F from an F table for these degrees of freedom, .05 level, is _____. The critical F from an F table for these degrees of freedom, .01 level, is _____. Does your calculated F exceed either of these critical Fs and if so, which ones? __________ The effect size for a oneway ANOVA is eta squared. Here is the formula – use it in the space to calculate eta squared for this data: 2 The rule of thumb for eta squared is: .01 – a small effect size .06 – a medium effect size SS b SS t D:\219514447.doc Page 6 of 6 .14 – a large effect size Now, you can fill out a standard ANOVA SOURCE TABLE: SOURCE SS df MS F p η2 Between Within Total Now, write a brief summary. Don’t worry about a multiple comparison test. You will run that on SPSS. If your ANOVA was significant, all you can say is that at least one pair of means differ and a multiple comparison test needs to be calculated to identify which of the three pairs differ. If not significant, then we have no evidence that any of the three pairs differ.


