Document 16036836
advertisement

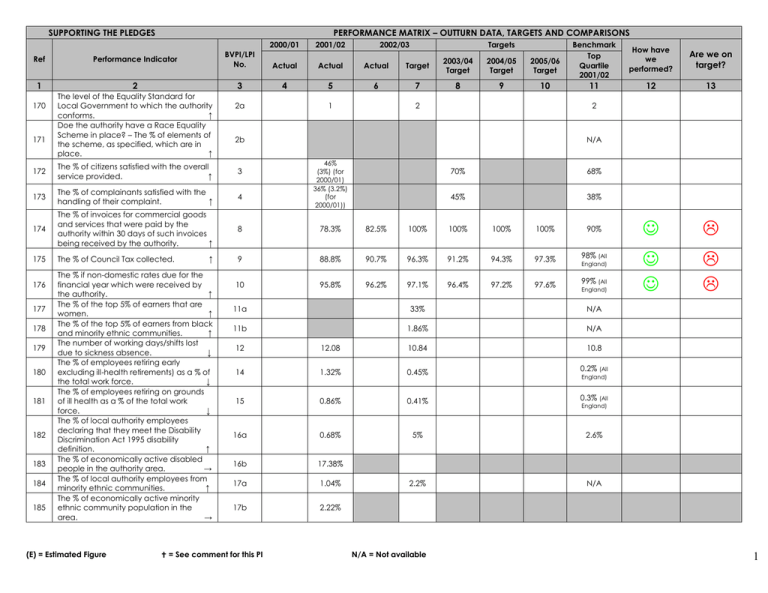
SUPPORTING THE PLEDGES PERFORMANCE MATRIX – OUTTURN DATA, TARGETS AND COMPARISONS 2000/01 Ref 171 2002/03 Performance Indicator BVPI/LPI No. Actual Actual Actual 2 3 4 5 6 1 170 2001/02 The level of the Equality Standard for Local Government to which the authority conforms. ↑ Doe the authority have a Race Equality Scheme in place? – The % of elements of the scheme, as specified, which are in place. ↑ 2a 1 Targets Target 2003/04 Target 2004/05 Target 2005/06 Target 7 8 9 10 2 Benchmark Top Quartile 2001/02 How have we performed? Are we on target? 11 12 13 2 2b N/A 46% (3%) (for 2000/01) 36% (3.2%) (for 2000/01)) 172 The % of citizens satisfied with the overall service provided. ↑ 3 173 The % of complainants satisfied with the handling of their complaint. ↑ 4 174 The % of invoices for commercial goods and services that were paid by the authority within 30 days of such invoices being received by the authority. ↑ 8 78.3% 82.5% 100% 100% 100% 100% 90% 175 The % of Council Tax collected. 9 88.8% 90.7% 96.3% 91.2% 94.3% 97.3% 98% (All 10 95.8% 96.2% 97.1% 96.4% 97.2% 97.6% 99% (All 176 177 178 179 180 181 182 183 184 185 ↑ The % if non-domestic rates due for the financial year which were received by the authority. ↑ The % of the top 5% of earners that are women. ↑ The % of the top 5% of earners from black and minority ethnic communities. ↑ The number of working days/shifts lost due to sickness absence. ↓ The % of employees retiring early excluding ill-health retirements) as a % of the total work force. ↓ The % of employees retiring on grounds of ill health as a % of the total work force. ↓ The % of local authority employees declaring that they meet the Disability Discrimination Act 1995 disability definition. ↑ The % of economically active disabled people in the authority area. → The % of local authority employees from minority ethnic communities. ↑ The % of economically active minority ethnic community population in the area. → (E) = Estimated Figure 70% 68% 45% 38% England) England) 11a 33% N/A 11b 1.86% N/A 12 12.08 10.84 10.8 14 1.32% 0.45% 0.2% (All 15 0.86% 0.41% 0.3% (All 16a 0.68% 5% 2.6% 16b 17.38% 17a 1.04% 2.2% N/A 17b 2.22% = See comment for this PI N/A = Not available England) England) 1 SUPPORTING THE PLEDGES PERFORMANCE MATRIX – OUTTURN DATA, TARGETS AND COMPARISONS 2000/01 Ref 187 188 189 190 191 192 193 194 195 196 2002/03 Performance Indicator BVPI/LPI No. Actual Actual Actual 2 3 4 5 156 157 1 186 2001/02 The % of authority buildings open to the public in which all public areas are suitable for and accessible to disabled people. ↑ The number of types of interactions that are enabled for electronic delivery as a % of the types of interactions that are legally permissible for electronic delivery↑ The energy consumption / (kw per square metre) of local authority operational property, compared with compatible buildings in the UK as a whole - electricity. ↓ The energy consumption (kw per square metre) of local authority operational property, compared with compatible buildings in the UK as a whole – fossil fuels. ↓ Average street lamp circuit energy consumption for street lights compared with the UK national average. ↓ Does the authority have a written and pro-active strategy for combating fraud and error which embraces specified initiatives including those sponsored by the Department of Works and Pensions, which is communicated regularly to all staff? The number of housing benefit claimants visited per 1,000 caseload. ↑ The number of fraud investigators employed per 1,000 caseload. → The number of fraud investigations per 1,000 caseload. → The number of prosecutions and sanctions per 1,000 caseload. → The average time for processing new benefit claims. ↓ (E) = Estimated Figure Targets Benchmark Top Quartile 2001/02 How have we performed? Are we on target? Target 2003/04 Target 2004/05 Target 2005/06 Target 6 7 8 9 10 11 12 13 6.6% 17.65% 6.6% 20% 23% 26% 26% 24.6% 34.5% 40% 73.4% 99.43% 100% 47% 158 kw/m2 157 kw/m2 156 kw/m2 N/A N/A N/A 533 kw/m2 532 kw/m2 531 kw/m2 N/A N/A N/A Not setNo benchm -ark data Not setNo benchm -ark data Not setNo benchm -ark data N/A N/A N/A See 76 a-d below See 76 a-d below See 76 a-d below Yes 76a 330 400 470 N/A - - 76b 0.25 0.27 0.28 N/A - - 76c 33 35 37 N/A - - 76d 1 1.1 1.2 N/A - - 48.5 days 45 days 41.5 days 36 days (All 180a (i) 159 kw/m2 180a (ii) 534 kw/m2 180b 76 78a = See comment for this PI Yes 65 days Yes 52 days Not set – new PI in 2002/0 3 Not set – new PI in 2002/0 3 Not set – new PI in 2002/0 3 Yes 60.5 days N/A = Not available England) 2 SUPPORTING THE PLEDGES PERFORMANCE MATRIX – OUTTURN DATA, TARGETS AND COMPARISONS 2000/01 Ref 198 199 200 201 202 203 204 205 206 207 208 209 2002/03 Performance Indicator BVPI/LPI No. Actual Actual Actual 2 3 4 5 78b 1 197 2001/02 The average time for processing notifications of changes of circumstance. ↓ The % of renewal claims processed on time. ↑ The % of cases for which the calculation of the amount of benefit due was correct on the basis of the information available for the decision for a sample of cases checked post-decision. ↑ The % of recoverable overpayments (excluding Council Tax Benefit) that were recovered in the year. ↑ Satisfaction with contact access facilities at the benefit office. ↑ Satisfaction with the service in the benefit office. ↑ Satisfaction with the telephone service. ↑ Satisfaction with the staff in the benefit office. ↑ Satisfaction with the clarity etc. of forms and leaflets. ↑ Satisfaction with the time taken to make a decision. ↑ Overall satisfaction with the benefits services. ↑ The % of authority expenditure on legal and advice services which is spent on services that have been awarded the Quality Mark and meet legal needs identified in the Community Legal Service Partnership strategic plan. ↑ The % of standard land searches carried out in 10 working days. ↑ How have we performed? Are we on target? Target 2004/05 Target 2005/06 Target 6 7 8 9 10 11 12 13 40 days 32 days 35 days 30 days 25 days 20 days 9 days (All 78c 74.59% 82% 77% 85% 87% 89% 83% (All 79a 94% 94% 92.2% 94.3% 96.1% 98% 98% 79b 4% 42.5% 40% 47.6% 52.7% 58% 64% 87% - - 86% - - 78% - - 87% - - 74% - - 85% - - - - 80a 80b 80c 80d 80e 80f 80g 82% (for 2000/01) 81% (for 2000/01) 73% (for 2000/01) 82% (for 2000/01) 69% (for 2000/01) 80% (for 2000/01) 91% (1%) (for 2000/01) 91.5%% 177 England) England) 84% 84% N/A 179 90.33% 91.81% 95% 96% 97% 98% 100% 21.33% 33.85% 24.2% 33.85% 30% 30% N/A Council Tax areas collected as a % of the total amount due. ↑ LPI 27 211 The % variation of outstanding debt greater than 30 days old. LPI 28 212 The average cost of collecting Council Tax for every home that has to pay. ↓ 213 The average cost of handling a Housing Benefit or Council Tax claim. ↓ (E) = Estimated Figure Benchmark Top Quartile 2001/02 2003/04 Target 210 ↑ Targets 45.4% 9.75% 47.5% 50% 55% reduction reduction reduction reduction reduction reduction LPI 29 £9.59 £10.68 (E) £9.59 £9.59 £9.59 £9.59 N/A LPI 30 £83.83 £92.99 (E) £78.43 £73.03 £67.63 £62.23 N/A = See comment for this PI 5.7% N/A = Not available N/A 3


