Document 16004659
advertisement

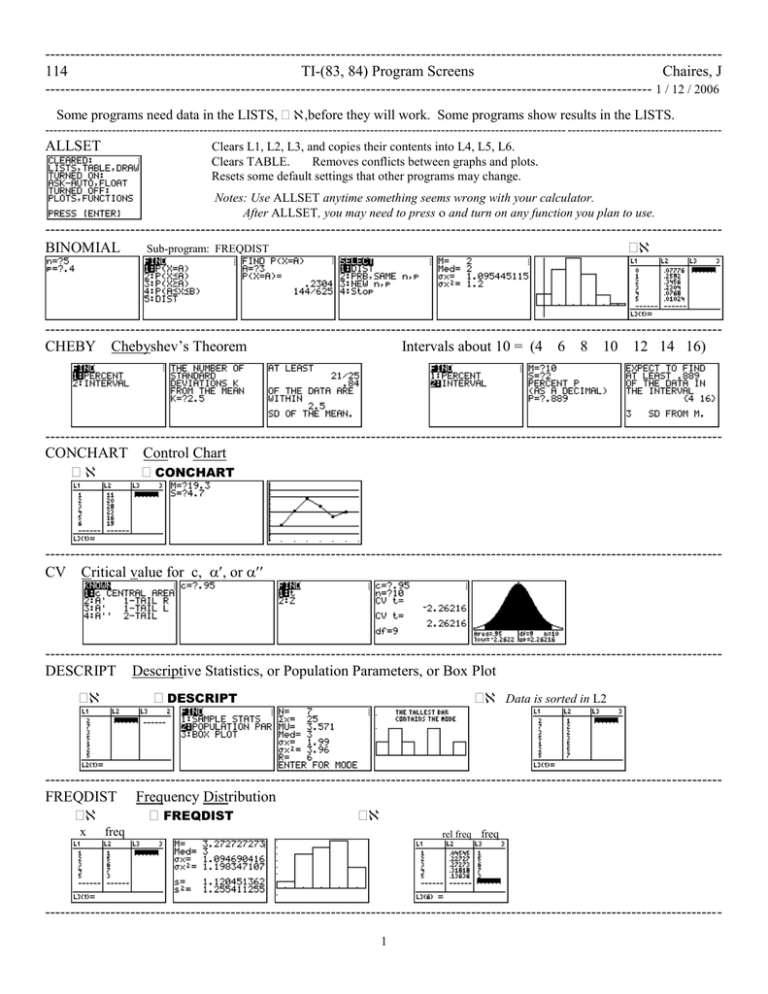
--------------------------------------------------------------------------------------------------------------------------------------114 TI-(83, 84) Program Screens Chaires, J ------------------------------------------------------------------------------------------------------------------------- 1 / 12 / 2006 Some programs need data in the LISTS, ,before they will work. Some programs show results in the LISTS. ----------------------------------------------------------------------------------------------------------------------------- ------------------------------------ALLSET Clears L1, L2, L3, and copies their contents into L4, L5, L6. Clears TABLE. Removes conflicts between graphs and plots. Resets some default settings that other programs may change. Notes: Use ALLSET anytime something seems wrong with your calculator. After ALLSET, you may need to press and turn on any function you plan to use. --------------------------------------------------------------------------------------------------------------------------------------BINOMIAL Sub-program: FREQDIST --------------------------------------------------------------------------------------------------------------------------------------CHEBY Chebyshev’s Theorem Intervals about 10 = (4 6 8 10 12 14 16) --------------------------------------------------------------------------------------------------------------------------------------CONCHART Control Chart CONCHART --------------------------------------------------------------------------------------------------------------------------------------CV Critical value for c, , or --------------------------------------------------------------------------------------------------------------------------------------DESCRIPT Descriptive Statistics, or Population Parameters, or Box Plot DESCRIPT Data is sorted in L2 --------------------------------------------------------------------------------------------------------------------------------------FREQDIST Frequency Distribution FREQDIST x freq rel freq freq --------------------------------------------------------------------------------------------------------------------------------------1 --------------------------------------------------------------------------------------------------------------------------------------HIST Makes a histogram with K bars of width W. Use OFFSET= .5 for whole data, .05 for data in tenths, etc. HIST Boundaries freq rel freq --------------------------------------------------------------------------------------------------------------------------------------INTERVAL Finds 1, 2, and 3 standard deviation intervals about the mean. 5.2 9.9 14.6 M–3sd M–2sd M–sd 19.3 M 24 28.7 33.4 M+sd M+2sd M+3sd 1sd-Int = (14.6, 24). 2sd-Int = (9.9, 28.7) --------------------------------------------------------------------------------------------------------------------------------------LINREG Linear Regression actual y predicted y error rel error LINREG TABLE x y predicted --------------------------------------------------------------------------------------------------------------------------------------NORMAL Finds the area under any normal curve and the boundary of an area under any normal curve. --------------------------------------------------------------------------------------------------------------------------------------PROBDIST Probability Distribution Sub-program: FREQDIST PROBDIST --------------------------------------------------------------------------------------------------------------------------------------RANDOM Computes random numbers Note: Your screen will have different random numbers. If repeated numbers are not allowed, run RANDOM again and select the numbers starting at the top of L1 --------------------------------------------------------------------------------------------------------------------------------------- --------------------------------------------------------------------------------------------------------------------------------------2 SAMPSIZE The sample size required for confidence c and maximum error E. --------------------------------------------------------------------------------------------------------------------------------------TRIM Finds the trimmed mean TRIM The 10% trimmed mean --------------------------------------------------------------------------------------------------------------------------------------WITDATA Where Is The Data? WITDATA Data is sorted in L2. 0’s in L3 show data, -3 and 25, that are not in the 1s interval. --------------------------------------------------------------------------------------------------------------------------------------ZTXVALUE Finds z-score, t-value, raw score x, standard error of , and the coefficient of variation. --------------------------------------------------------------------------------------------------------------------------------------Programs ALLSET BINOMIAL CHEBY CONCHART CV DESCRIPT FREQDIST HIST INTERVAL LINREG NORMAL PROBDIST RANDOM SAMPSIZE TRIM WITDATA ZTXVALUE --------------------------------------------------------------------------------------------------------------------------------------- 3

