251x0811 2/11/07 ECO251 QBA1 Student Number: _________________________
advertisement

251x0811
2/11/07
ECO251 QBA1
FIRST EXAM
February 21, 2008
TAKE HOME SECTION
Name: _________________________
Student Number: _________________________
Throughout this exam show your work! Please indicate clearly what sections of the problem you are
answering and what formulas you are using. Turn this is with your in-class exam.
Part III. Do all the Following (12+ Points). The problems are based on problems by Doane and Seward.
Show your work!
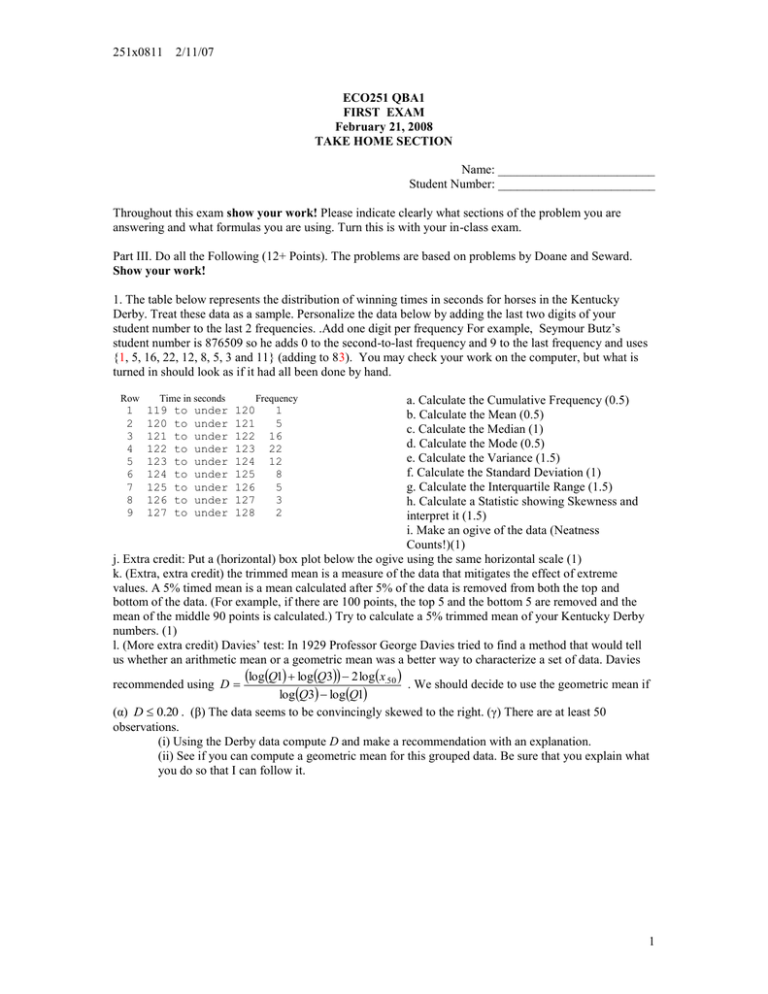
1. The table below represents the distribution of winning times in seconds for horses in the Kentucky
Derby. Treat these data as a sample. Personalize the data below by adding the last two digits of your
student number to the last 2 frequencies. .Add one digit per frequency For example, Seymour Butz’s
student number is 876509 so he adds 0 to the second-to-last frequency and 9 to the last frequency and uses
{1, 5, 16, 22, 12, 8, 5, 3 and 11} (adding to 83). You may check your work on the computer, but what is
turned in should look as if it had all been done by hand.
Row
Time in seconds
Frequency
a. Calculate the Cumulative Frequency (0.5)
b. Calculate the Mean (0.5)
c. Calculate the Median (1)
d. Calculate the Mode (0.5)
e. Calculate the Variance (1.5)
f. Calculate the Standard Deviation (1)
g. Calculate the Interquartile Range (1.5)
h. Calculate a Statistic showing Skewness and
interpret it (1.5)
i. Make an ogive of the data (Neatness
Counts!)(1)
j. Extra credit: Put a (horizontal) box plot below the ogive using the same horizontal scale (1)
k. (Extra, extra credit) the trimmed mean is a measure of the data that mitigates the effect of extreme
values. A 5% timed mean is a mean calculated after 5% of the data is removed from both the top and
bottom of the data. (For example, if there are 100 points, the top 5 and the bottom 5 are removed and the
mean of the middle 90 points is calculated.) Try to calculate a 5% trimmed mean of your Kentucky Derby
numbers. (1)
l. (More extra credit) Davies’ test: In 1929 Professor George Davies tried to find a method that would tell
us whether an arithmetic mean or a geometric mean was a better way to characterize a set of data. Davies
logQ1 logQ3 2 logx.50 . We should decide to use the geometric mean if
recommended using D
log Q3 log Q1
(α) D 0.20 . (β) The data seems to be convincingly skewed to the right. (γ) There are at least 50
observations.
(i) Using the Derby data compute D and make a recommendation with an explanation.
(ii) See if you can compute a geometric mean for this grouped data. Be sure that you explain what
you do so that I can follow it.
1
2
3
4
5
6
7
8
9
119
120
121
122
123
124
125
126
127
to
to
to
to
to
to
to
to
to
under
under
under
under
under
under
under
under
under
120
121
122
123
124
125
126
127
128
1
5
16
22
12
8
5
3
2
1
251x0711
2/12/07
2. The sales of your firm over the last 5 years are as follows.
Year
1
2
3
4
5
Sales ($millions)
131
227
311
354
403
Personalize these data by subtracting the last two digits of your student number from the first sales figure.
For example, Ima Badrisk’s student number is 876519, so she subtracts 19 from 131 to get 112. The effect
of this will be to raise the growth rates in a). Do the following (3)
a) Find the average growth rate of sales by taking a geometric mean using the four year-to-year growth
rates.
b) Find the harmonic mean of your sales numbers.
c) Find the root-mean-square of your sales numbers.
d) (Extra credit) Compute the geometric mean from a) using natural and/or base 10 logarithms. (1 point
extra credit each).
2


