Investigation of the impact of dissolved oxygen on the protein... Streptococcus zooepidemicus
advertisement
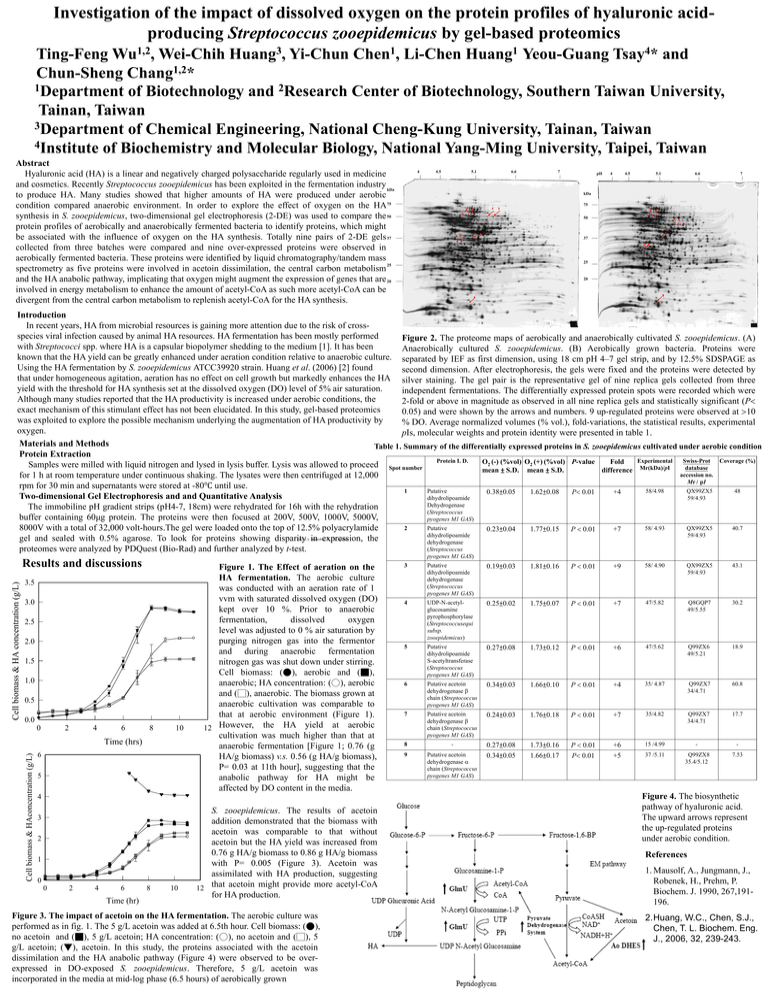
Investigation of the impact of dissolved oxygen on the protein profiles of hyaluronic acidproducing Streptococcus zooepidemicus by gel-based proteomics 1,2 Wu , 3 Huang , 1 Chen , 1 Huang 4 Tsay * Ting-Feng Wei-Chih Yi-Chun Li-Chen Yeou-Guang and 1,2 Chun-Sheng Chang * 1Department of Biotechnology and 2Research Center of Biotechnology, Southern Taiwan University, Tainan, Taiwan 3Department of Chemical Engineering, National Cheng-Kung University, Tainan, Taiwan 4Institute of Biochemistry and Molecular Biology, National Yang-Ming University, Taipei, Taiwan Abstract Hyaluronic acid (HA) is a linear and negatively charged polysaccharide regularly used in medicine and cosmetics. Recently Streptococcus zooepidemicus has been exploited in the fermentation industry kDa to produce HA. Many studies showed that higher amounts of HA were produced under aerobic condition compared anaerobic environment. In order to explore the effect of oxygen on the HA75 synthesis in S. zooepidemicus, two-dimensional gel electrophoresis (2-DE) was used to compare the 50 protein profiles of aerobically and anaerobically fermented bacteria to identify proteins, which might be associated with the influence of oxygen on the HA synthesis. Totally nine pairs of 2-DE gels 37 collected from three batches were compared and nine over-expressed proteins were observed in aerobically fermented bacteria. These proteins were identified by liquid chromatography/tandem mass 25 spectrometry as five proteins were involved in acetoin dissimilation, the central carbon metabolism and the HA anabolic pathway, implicating that oxygen might augment the expression of genes that are 20 involved in energy metabolism to enhance the amount of acetyl-CoA as such more acetyl-CoA can be divergent from the central carbon metabolism to replenish acetyl-CoA for the HA synthesis. 4 4.5 5.1 6.6 7 pH 4 4.5 5.1 6.6 7 kDa 75 4 3 5 21 3 21 50 5 4 9 9 7 6 37 76 25 20 8 8 Introduction In recent years, HA from microbial resources is gaining more attention due to the risk of crossspecies viral infection caused by animal HA resources. HA fermentation has been mostly performed Figure 2. The proteome maps of aerobically and anaerobically cultivated S. zooepidemicus. (A) with Streptococci spp. where HA is a capsular biopolymer shedding to the medium [1]. It has been Anaerobically cultured S. zooepidemicus. (B) Aerobically grown bacteria. Proteins were known that the HA yield can be greatly enhanced under aeration condition relative to anaerobic culture. separated by IEF as first dimension, using 18 cm pH 4–7 gel strip, and by 12.5% SDSPAGE as Using the HA fermentation by S. zooepidemicus ATCC39920 strain. Huang et al. (2006) [2] found second dimension. After electrophoresis, the gels were fixed and the proteins were detected by that under homogeneous agitation, aeration has no effect on cell growth but markedly enhances the HA silver staining. The gel pair is the representative gel of nine replica gels collected from three yield with the threshold for HA synthesis set at the dissolved oxygen (DO) level of 5% air saturation. independent fermentations. The differentially expressed protein spots were recorded which were Although many studies reported that the HA productivity is increased under aerobic conditions, the 2-fold or above in magnitude as observed in all nine replica gels and statistically significant (P exact mechanism of this stimulant effect has not been elucidated. In this study, gel-based proteomics 0.05) and were shown by the arrows and numbers. 9 up-regulated proteins were observed at 10 was exploited to explore the possible mechanism underlying the augmentation of HA productivity by % DO. Average normalized volumes (% vol.), fold-variations, the statistical results, experimental oxygen. pIs, molecular weights and protein identity were presented in table 1. Materials and Methods Table 1. Summary of the differentially expressed proteins in S. zooepidemicus cultivated under aerobic condition Protein Extraction Protein I. D. Experimental Swiss-Prot Coverage (%) O2 (-) (%vol) O2 (+) (%vol) P-value Fold Samples were milled with liquid nitrogen and lysed in lysis buffer. Lysis was allowed to proceed Spot number database mean ± S.D. mean ± S.D. difference Mr(kDa)/pI accession no. for 1 h at room temperature under continuous shaking. The lysates were then centrifuged at 12,000 Mr / pI rpm for 30 min and supernatants were stored at -80℃ until use. 1 Putative 58/4.98 QX99ZX5 48 0.38±0.05 1.62±0.08 +4 P 0.01 Two-dimensional Gel Electrophoresis and and Quantitative Analysis dihydrolipoamide 59/4.93 Dehydrogenase The immobiline pH gradient strips (pH4-7, 18cm) were rehydrated for 16h with the rehydration (Streptococcus buffer containing 60μg protein. The proteins were then focused at 200V, 500V, 1000V, 5000V, pyogenes M1 GAS) 2 Putative 58/ 4.93 QX99ZX5 40.7 8000V with a total of 32,000 volt-hours.The gel were loaded onto the top of 12.5% polyacrylamide 0.23±0.04 1.77±0.15 +7 P 0.01 dihydrolipoamide 59/4.93 gel and sealed with 0.5% agarose. To look for proteins showing disparity in expression, the dehydrogenase (Streptococcus proteomes were analyzed by PDQuest (Bio-Rad) and further analyzed by t-test. a) O2 (-): anaerobic; O2 (+): aerobic pyogenes M1 GAS) Cell biomass & HA concentration (g/L) Results and discussions 3.5 3.0 2.5 2.0 1.5 1.0 0.5 0.0 0 2 4 6 8 10 Cell biomass & HAconcentration (g/L) Time (hrs) 6 5 Figure 1. The Effect of aeration on the HA fermentation. The aerobic culture was conducted with an aeration rate of 1 vvm with saturated dissolved oxygen (DO) kept over 10 %. Prior to anaerobic fermentation, dissolved oxygen level was adjusted to 0 % air saturation by purging nitrogen gas into the fermentor and during anaerobic fermentation nitrogen gas was shut down under stirring. Cell biomass: (●), aerobic and (■), anaerobic; HA concentration: (○), aerobic and (□), anaerobic. The biomass grown at anaerobic cultivation was comparable to that at aerobic environment (Figure 1). 12 However, the HA yield at aerobic cultivation was much higher than that at anaerobic fermentation [Figure 1; 0.76 (g HA/g biomass) v.s. 0.56 (g HA/g biomass), P= 0.03 at 11th hour], suggesting that the anabolic pathway for HA might be affected by DO content in the media. 4 3 2 1 0 0 2 4 6 Time (hr) 8 10 S. zooepidemicus. The results of acetoin addition demonstrated that the biomass with acetoin was comparable to that without acetoin but the HA yield was increased from 0.76 g HA/g biomass to 0.86 g HA/g biomass with P= 0.005 (Figure 3). Acetoin was assimilated with HA production, suggesting 12 that acetoin might provide more acetyl-CoA for HA production. Figure 3. The impact of acetoin on the HA fermentation. The aerobic culture was performed as in fig. 1. The 5 g/L acetoin was added at 6.5th hour. Cell biomass: (●), no acetoin and (■), 5 g/L acetoin; HA concentration: (○), no acetoin and (□), 5 g/L acetoin; (▼), acetoin. In this study, the proteins associated with the acetoin dissimilation and the HA anabolic pathway (Figure 4) were observed to be overexpressed in DO-exposed S. zooepidemicus. Therefore, 5 g/L acetoin was incorporated in the media at mid-log phase (6.5 hours) of aerobically grown 3 Putative dihydrolipoamide dehydrogenase (Streptococcus pyogenes M1 GAS) 0.19±0.03 1.81±0.16 P 0.01 +9 58/ 4.90 QX99ZX5 59/4.93 43.1 4 UDP-N-acetylglucosamine pyrophosphorylase (Streptococcusequi subsp. zooepidemicus) 0.25±0.02 1.75±0.07 P 0.01 +7 47/5.82 Q8GQP7 49/5.55 30.2 5 Putative dihydrolipoamide S-acetyltransferase (Streptococcus pyogenes M1 GAS) 0.27±0.08 1.73±0.12 P 0.01 +6 47/5.62 Q99ZX6 49/5.21 18.9 6 Putative acetoin dehydrogenase chain (Streptococcus pyogenes M1 GAS) 0.34±0.03 1.66±0.10 P 0.01 +4 35/ 4.87 Q99ZX7 34/4.71 60.8 7 Putative acetoin dehydrogenase chain (Streptococcus pyogenes M1 GAS) 0.24±0.03 1.76±0.18 P 0.01 +7 35/4.82 Q99ZX7 34/4.71 17.7 8 - P 0.01 P 0.01 +6 +5 - - Putative acetoin dehydrogenase chain (Streptococcus pyogenes M1 GAS) 1.73±0.16 1.66±0.17 15 /4.99 9 0.27±0.08 0.34±0.05 37 /5.11 Q99ZX8 35.4/5.12 7.53 Figure 4. The biosynthetic pathway of hyaluronic acid. The upward arrows represent the up-regulated proteins under aerobic condition. References 1. Mausolf, A., Jungmann, J., Robenek, H., Prehm, P. Biochem. J. 1990, 267,191196. 2.Huang, W.C., Chen, S.J., Chen, T. L. Biochem. Eng. J., 2006, 32, 239-243.

