A Case Study of HPC Metrics Collection and Analysis
advertisement
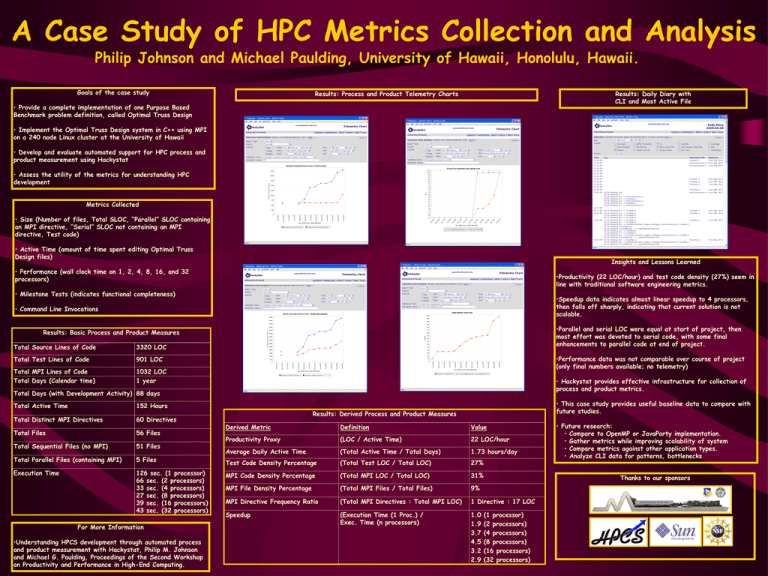
A Case Study of HPC Metrics Collection and Analysis Philip Johnson and Michael Paulding, University of Hawaii, Honolulu, Hawaii. Goals of the case study Results: Process and Product Telemetry Charts Results: Daily Diary with CLI and Most Active File • Provide a complete implementation of one Purpose Based Benchmark problem definition, called Optimal Truss Design • Implement the Optimal Truss Design system in C++ using MPI on a 240 node Linux cluster at the University of Hawaii • Develop and evaluate automated support for HPC process and product measurement using Hackystat • Assess the utility of the metrics for understanding HPC development Metrics Collected • Size (Number of files, Total SLOC, “Parallel” SLOC containing an MPI directive, “Serial” SLOC not containing an MPI directive, Test code) • Active Time (amount of time spent editing Optimal Truss Design files) Insights and Lessons Learned • Performance (wall clock time on 1, 2, 4, 8, 16, and 32 processors) •Productivity (22 LOC/hour) and test code density (27%) seem in line with traditional software engineering metrics. • Milestone Tests (indicates functional completeness) •Speedup data indicates almost linear speedup to 4 processors, then falls off sharply, indicating that current solution is not scalable. • Command Line Invocations •Parallel and serial LOC were equal at start of project, then most effort was devoted to serial code, with some final enhancements to parallel code at end of project. Results: Basic Process and Product Measures Total Source Lines of Code 3320 LOC Total Test Lines of Code 901 LOC Total MPI Lines of Code Total Days (Calendar time) 1032 LOC 1 year •Performance data was not comparable over course of project (only final numbers available; no telemetry) • Hackystat provides effective infrastructure for collection of process and product metrics. Total Days (with Development Activity) 88 days Total Active Time 152 Hours Total Distinct MPI Directives 60 Directives Total Files 56 Files Total Sequential Files (no MPI) 51 Files Total Parallel Files (containing MPI) 5 Files Execution Time 126 sec. (1 processor) 66 sec. (2 processors) 33 sec. (4 processors) 27 sec. (8 processors) 39 sec. (16 processors) 43 sec. (32 processors) For More Information •Understanding HPCS development through automated process and product measurement with Hackystat, Philip M. Johnson and Michael G. Paulding, Proceedings of the Second Workshop on Productivity and Performance in High-End Computing. • This case study provides useful baseline data to compare with future studies. Results: Derived Process and Product Measures Derived Metric Definition Value Productivity Proxy (LOC / Active Time) 22 LOC/hour Average Daily Active Time (Total Active Time / Total Days) 1.73 hours/day Test Code Density Percentage (Total Test LOC / Total LOC) 27% MPI Code Density Percentage (Total MPI LOC / Total LOC) 31% MPI File Density Percentage (Total MPI Files / Total Files) 9% MPI Directive Frequency Ratio (Total MPI Directives : Total MPI LOC) 1 Directive : 17 LOC Speedup (Execution Time (1 Proc.) / Exec. Time (n processors) 1.0 1.9 3.7 4.5 3.2 2.9 • Future research: • Compare to OpenMP or JavaParty implementation. • Gather metrics while improving scalability of system • Compare metrics against other application types. • Analyze CLI data for patterns, bottlenecks Thanks to our sponsors (1 processor) (2 processors) (4 processors) (8 processors) (16 processors) (32 processors)
