Week 6: In Class – Costs of Production
advertisement
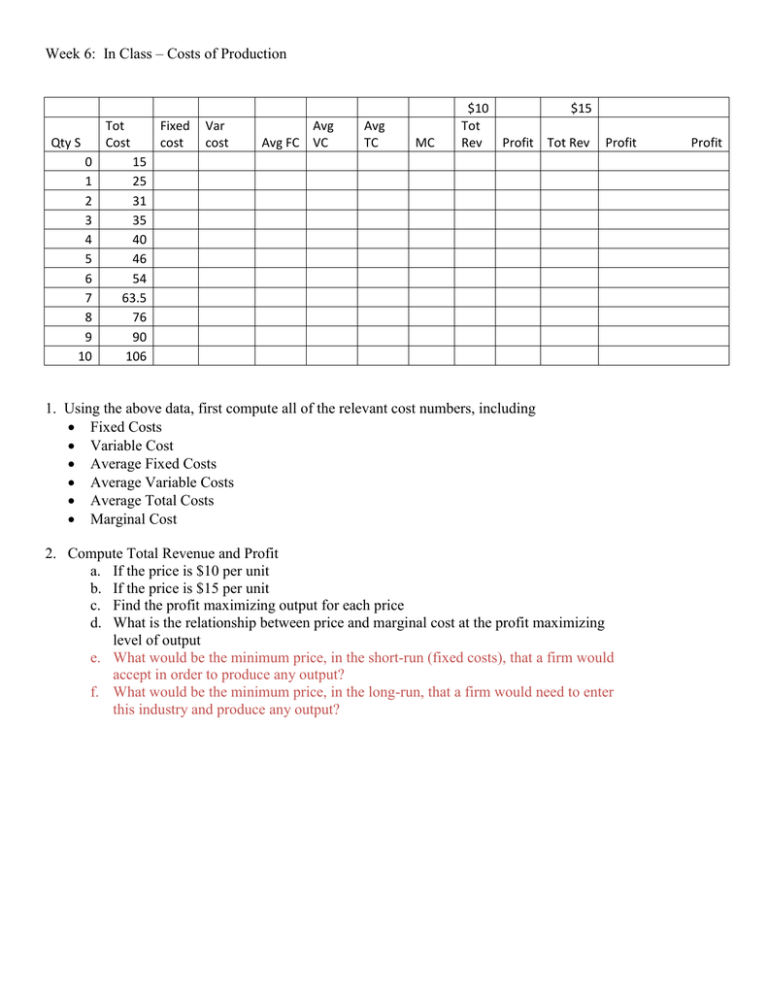
Week 6: In Class – Costs of Production Qty S 0 1 2 3 4 5 6 7 8 9 10 Tot Cost Fixed cost Var cost Avg Avg FC VC Avg TC MC $10 $15 Tot Rev Profit Tot Rev Profit 15 25 31 35 40 46 54 63.5 76 90 106 1. Using the above data, first compute all of the relevant cost numbers, including Fixed Costs Variable Cost Average Fixed Costs Average Variable Costs Average Total Costs Marginal Cost 2. Compute Total Revenue and Profit a. If the price is $10 per unit b. If the price is $15 per unit c. Find the profit maximizing output for each price d. What is the relationship between price and marginal cost at the profit maximizing level of output e. What would be the minimum price, in the short-run (fixed costs), that a firm would accept in order to produce any output? f. What would be the minimum price, in the long-run, that a firm would need to enter this industry and produce any output? Profit Use the figure for the question(s) below. 23) Which shows long- and short-run average costs for a firm. Each shortrun average total cost curve corresponds with a different level of A) technology. B) minimum efficient scale. C) raw materials. D) labor. E) capital. 23) ______ 24) Which shows long- and short-run average costs for a firm. If this firm expects to produce 200 units, in the long run, it should build a factory that corresponds with A) . B) . C) . D) LRAC. E) 24) ______
