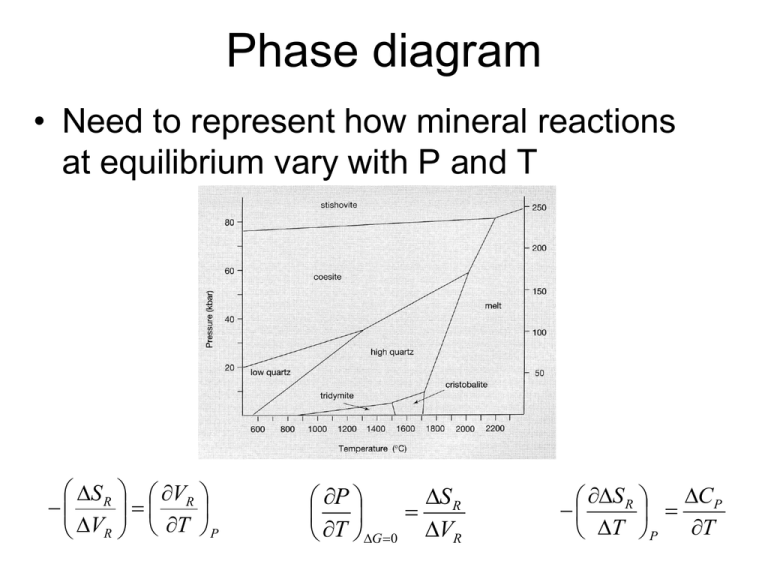
Phase diagram • Need to represent how mineral reactions S
advertisement

Phase diagram • Need to represent how mineral reactions at equilibrium vary with P and T S R VR V T P R S R P T G 0 VR CP S R T P T P-X stability and mixing Gibbs Phase Rule • The number of variables which are required to describe the state of a system: • p+f=c+2 f=c-p+2 – Where p=# of phases, c= # of components, f= degrees of freedom – The degrees of freedom correspond to the number of intensive variables that can be changed without changing the number of phases in the system Variance and f • f=c-p+2 • Consider a one component (unary) diagram • If considering presence of 1 phase (the liquid, solid, OR gas) it is divariant • 2 phases = univariant • 3 phases = invariant Melts • Liquid composed of predominantly silica and oxygen. Like water, other ions impart greater conductivity to the solution • Si and O is polymerized in the liquid to differing degrees – how ‘rigid’ this network may be is uncertain… • Viscosity of the liquid increases with increased silica content, i.e. it has less resistance to flow with more SiO2… related to polymerization?? • There is H2O is magma 2-6% typically – H2O decreases the overall melting T of a magma, what does that mean for mineral crystallization? Thermodynamic definitions • Gi(solid) = Gi(melt) • Ultimately the relationships between these is related to the entropy of fusion (S0fus), which is the entropy change associated with the change in state from liquid to crystal dT RT fus 0 dX S fus i • These entropies are the basis for the order associated with Bowen’s reaction series greater bonding changes in networks, greater entropy change lower T equilibrium Melt-crystal equilibrium • Precipitated crystals react with cooling liquid, eventually will re-equilibrate back, totally cooled magma xstals show same composition • UNLESS it cools so quickly the xstal becomes zoned or the early precipitates are segregated and removed from contact with the bulk of the melt Why aren’t all feldspars zoned? • Kinetics, segregation • IF there is sufficient time, the crystals will re-equilibrate with the magma they are in – and reflect the total Na-Ca content of the magma • IF not, then different minerals of different composition will be present in zoned plagioclase or segregated from each other physically Exsolution P-X stability and mixing • More than 1 crystal can precipitate from a melt – different crystals, different stabilities… – 2+ minerals that do not share equilibrium in a melt are immiscible (opposite of a solid solution) – Liquidus Line describing equilibrium between melt and one mineral at equilibrium – Solidus Line describing equilibrium with melt and solid – Eutectic point of composition where melt and solid can coexist at equilibrium Diopside is a pyroxene Anorthite is a feldspar Eutectic Solidus Liquidus • Melt at composition X cools to point Y where anorthite (NOT diopside at all) crystallizes, the melt becomes more diopside rich to point C, precipitating more anorthite with the melt becoming more diopside-rich • This continues and the melt continues to cool and shift composition until it reaches the eutectic when diopside can start forming At eutectic, diopside AND anorhtite crystals precipitate Lever Rule diopside/anorthite (42%/58%) crystallize until last of melt precipitates and the rock composition is Z A B C S1 S2 Z • Melting when heated to eutectic, the rock would melt such that all the heat goes towards heat of fusion of diopside and anorthite, melts so that 42% diopside / 58% anorthite… • When diopside gone, temperature can increase and rest of anorthite can melt (along liquidus) • How does free energy change with T and P? • From G=H-TS: T2 T2 T1 T1 GP2 ,T2 GP1 ,T1 S P1,T 1 (T2 T1 ) CP( P1) dT T 2 CP( P1) T P2 dT VT2 dP P1 • T and P changes affect free energy and can drive reactions!! Volume Changes (Equation of State) For Minerals: Volume is related to energy changes: dG V dP T Mineral volume changes as a function of T: , coefficient of thermal expansion 1 V V T P Mineral volume changes as a function of P: , coefficient of isothermal expansion 1 V V P T Volume Changes (Equation of State) • Gases and liquids undergo significant volume changes with T and P changes • Number of empirically based EOS solns.. • For metamorphic environments: – Redlich and Kwong equation: aRw RT P 1/ 2 V bRK T V (V bRK ) • V-bar denotes a molar quatity, aRw and bRK are constants Phase Relations • Rule: At equilibrium, reactants and products have the same Gibbs Energy – For 2+ things at equilibrium, can investigate the P-T relationships different minerals change with T-P differently… • For GR = SRdT + VRdP, at equilibrium, G0, rearranging: S R P T G 0 VR Clausius-Clapeyron equation Remember that a line on a phase diagram describes equilibrium, GR=0!! S R P T G 0 VR SR change with T or P? CP S R T P T S V R R VR T T P V = Vº(1-P) S S P S 0 dP S 0 VdP P T P2 P2 P1 P1 S 0 V 0 P ( P22 P12 2 V for solids stays nearly constant as P, T change, V for liquids and gases DOES NOT • Solid-solid reactions linear S and V nearly constant, S/V constant + slope in diagram • For metamorphic reactions involving liquids or gases, volume changes are significant, V terms large and a function of T and P (and often complex functions) – slope is not linear and can change sign (change slope + to –) S R P T G 0 VR Example – Diamond-graphite • To get C from graphite to diamond at 25ºC requires 1600 MPa of pressure, let’s calculate what P it requires at 1000ºC: graphite diamond (K-1) 1.05E-05 7.50E-06 (MPa-1) 3.08E-05 2.27E-06 Sº (J/mol K) 5.74 2.38 Vº (cm3/mol) 5.2982 3.417 Clausius-Clapyron Example


