Experimental gaps and biodiversity responses in the Vermont Forest Ecosystem
advertisement

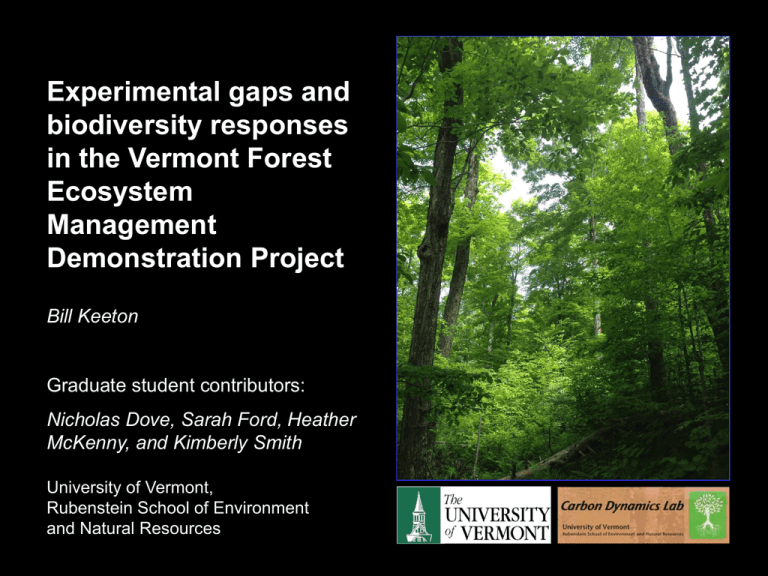
Experimental gaps and biodiversity responses in the Vermont Forest Ecosystem Management Demonstration Project Bill Keeton Graduate student contributors: Nicholas Dove, Sarah Ford, Heather McKenny, and Kimberly Smith University of Vermont, Rubenstein School of Environment and Natural Resources Photo credit: Sarah Ford Rothwald Old-growth Forest, Austrian Alps Vermont Forest Ecosystem Management Demonstration Project Structural Complexity Enhancement (SCE) Structural Objective Multi-layered canopy Elevated large snag densities Elevated downed woody debris densities and volume Variable horizontal density Re-allocation of basal area to larger diameter classes Accelerated growth in largest trees Silvicultural Technique Single tree selection using a target diameter distribution Release advanced regeneration Establish new cohort Girdling of selected medium to large sized, low vigor trees Felling and leaving, or Pulling over and leaving Harvest trees clustered around “release trees” Variable density marking Rotated sigmoid diameter distribution High target basal area Maximum target tree size set at 90 cm dbh Full and partial crown release of largest, healthiest trees Gaps are an Element of the Study • Crown release in SCE resulted in clustered harvesting and small gaps (mean opening size = 0.02 ha) • Modified group selection (mean opening size = 0.05 ha) Artificial gaps (“groups”) specifics: • Gap sizes based on mean 0.05 ha (1/8 acre) disturbance scale (from Seymour et al. 2002) • Gap sizes are irregular • Gap shapes are irregular • Light retention within gaps Study Sites Study Areas: Mount Mansfield State Forest Jericho Research Forest Paul Smith’s College (FERDA cooperation) • Mature, multi-aged northern hardwoods • History of thinning and selection harvesting • Mid-elevation, moderate productivity N 100 0 100 200 Meters FEMDP Research Response Indicators: Growth and yield Stand structure and dynamics Herbaceous vegetation Birds Small mammals Amphibians Fungi Soil invertebrates Soil OM and macro-nutrients Economic tradeoffs and feasibility Biomass and carbon Tree Regeneration © Al Sheldon Leaf Area Index Changes: Pre-Treatment to Post-Treatment Spatial Variability: • SCE v. GS; not sign. • SCE & GS > STS; P < 0.05 10 5 LAI Percent Change 0 -5 Controls -10 Structural Complexity Enhancement Single-Tree Selection Group Selection -15 -20 -25 -30 ANOVA: Fcrit, 0.05 = 2.867 F = 11.435 P < 0.001 F tests for variance: SCE > STS: P = 0.031 GS > STS: P = 0.010 SCE > GS: P = 0.296 -35 -40 Keeton. 2006. For. Ecol. and Mgt. Coarse Woody Debris Enhancement Red-backed Salamander Response Based on Occupancy Modeling log(λ )(β0 + β1*density CWD 1-2 + β2*density CWD 3-5 + β 3 * s i t e + β 4 * % r e l a t i v e d e n s i t y o v e r s t o r y t r e e s ) 40 Density CWD 1-2 Mean abundance λi Density CWD 3-5 Relative density overstory trees 35 30 25 20 15 10 5 0 -3 -2 -1 0 1 2 3 Standardized covariates McKenny, Keeton, and Donovan. 2006 Response of Late-successional Understory Plant Species 2 1.2 0.9 Diversity Richness 4 Control Group selection SCE Single-tree selection 0 -2 0.6 0.3 0 -0.3 -0.6 -4 -1 1 2 Year Richness:* p = 0.012 SCE > GS * Following Hill’s (1973) series of diversity Indices 3 4 -1 1 2 3 4 Year Shannon Index:* p = 0.009 SCE > CON Smith, Keeton, Twery, and Tobi. 2008. CJFR Locally Extirpated Species Percent Species Lost by Treatment % Species Lost 16 12 ANOVA: p = 0.07 8 4 0 GS STS SCE Treatment CON Fungal Responses; Aboveground Sporocarps Dove and Keeton. 2014. Fungal Ecology Fungi Responses: Classification and Regression Tree CWD Volume (Decay classes 3‐5) < 71.42 m3/ha Initial formula included 7 structural variables Dead Stem Density < 28.85 trees/ha 12.250 Live Aboveground Biomass < 69.25 Mg/ha 4.188 Total CWD Volume < 68.59 m3/ha 5.625 *Response Variable = Species Richness 5.250 13.500 Dove and Keeton. 2014. Fungal Ecology Biomass and carbon in downed logs 10 years post-harvest 30 Mg/ha 25 20 Biomass (Mg/ha) Carbon (Mg/ha) 15 10 5 0 SCE Conventional Control Treatment Type Closing Thoughts • Silvicultural gaps promote some elements of late-successional biodiversity, depending on within gap structure • Spatial configuration w/closed canopy patches also important • Manage for temporal and spatial variability • There is no “one-size-fits all” approach; mix it up! • Adapt, learn from unanticipated results Acknowledgements • Vermont Monitoring Cooperative • U.S. National Science Foundation • Northeastern States Research Cooperative • USDA McIntire-Stennis Forest Research Program • USDA National Research Initiative


