Document 15549576
advertisement
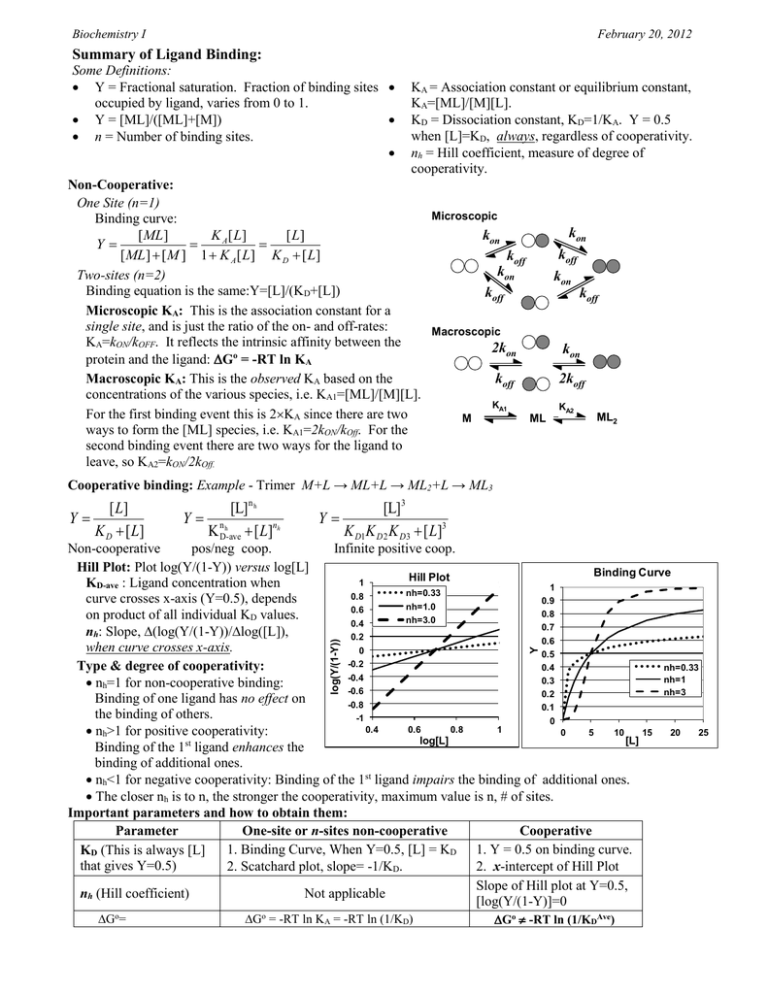
Biochemistry I February 20, 2012 Summary of Ligand Binding: Some Definitions: Y = Fractional saturation. Fraction of binding sites occupied by ligand, varies from 0 to 1. Y = [ML]/([ML]+[M]) n = Number of binding sites. KA = Association constant or equilibrium constant, KA=[ML]/[M][L]. KD = Dissociation constant, KD=1/KA. Y = 0.5 when [L]=KD, always, regardless of cooperativity. nh = Hill coefficient, measure of degree of cooperativity. Non-Cooperative: One Site (n=1) Microscopic Binding curve: kon kon [ ML ] K A [ L] [ L] Y koff [ ML ] [ M ] 1 K A [ L] K D [ L] koff kon Two-sites (n=2) kon Binding equation is the same:Y=[L]/(KD+[L]) koff koff Microscopic KA: This is the association constant for a single site, and is just the ratio of the on- and off-rates: Macroscopic KA=kON/kOFF. It reflects the intrinsic affinity between the 2kon kon protein and the ligand: Go = -RT ln KA Macroscopic KA: This is the observed KA based on the koff 2koff concentrations of the various species, i.e. KA1=[ML]/[M][L]. KA1 KA2 For the first binding event this is 2KA since there are two ML2 M ML ways to form the [ML] species, i.e. KA1=2kON/kOff. For the second binding event there are two ways for the ligand to leave, so KA2=kON/2kOff. Cooperative binding: Example - Trimer M+L → ML+L → ML2+L → ML3 [ L] Y K D [ L] [L] n h Y nh K D-ave [ L]nh [L]3 Y K D1K D 2 K D3 [ L]3 Go= Go = -RT ln KA = -RT ln (1/KD) Y log(Y/(1-Y)) Non-cooperative pos/neg coop. Infinite positive coop. Hill Plot: Plot log(Y/(1-Y)) versus log[L] Binding Curve Hill Plot 1 KD-ave : Ligand concentration when 1 nh=0.33 0.8 curve crosses x-axis (Y=0.5), depends 0.9 nh=1.0 0.6 0.8 on product of all individual KD values. nh=3.0 0.4 0.7 nh: Slope, (log(Y/(1-Y))/log([L]), 0.2 0.6 when curve crosses x-axis. 0 0.5 -0.2 Type & degree of cooperativity: nh=0.33 0.4 -0.4 nh=1 0.3 nh=1 for non-cooperative binding: -0.6 nh=3 0.2 Binding of one ligand has no effect on -0.8 0.1 the binding of others. -1 0 0.4 0.6 0.8 1 nh>1 for positive cooperativity: 0 5 10 15 20 25 [L] log[L] Binding of the 1st ligand enhances the binding of additional ones. nh<1 for negative cooperativity: Binding of the 1st ligand impairs the binding of additional ones. The closer nh is to n, the stronger the cooperativity, maximum value is n, # of sites. Important parameters and how to obtain them: Parameter One-site or n-sites non-cooperative Cooperative 1. Binding Curve, When Y=0.5, [L] = KD 1. Y = 0.5 on binding curve. KD (This is always [L] that gives Y=0.5) 2. Scatchard plot, slope= -1/KD. 2. x-intercept of Hill Plot Slope of Hill plot at Y=0.5, nh (Hill coefficient) Not applicable [log(Y/(1-Y)]=0 Go -RT ln (1/KDAve) Biochemistry I February 20, 2012
