4 Step Analysis
advertisement
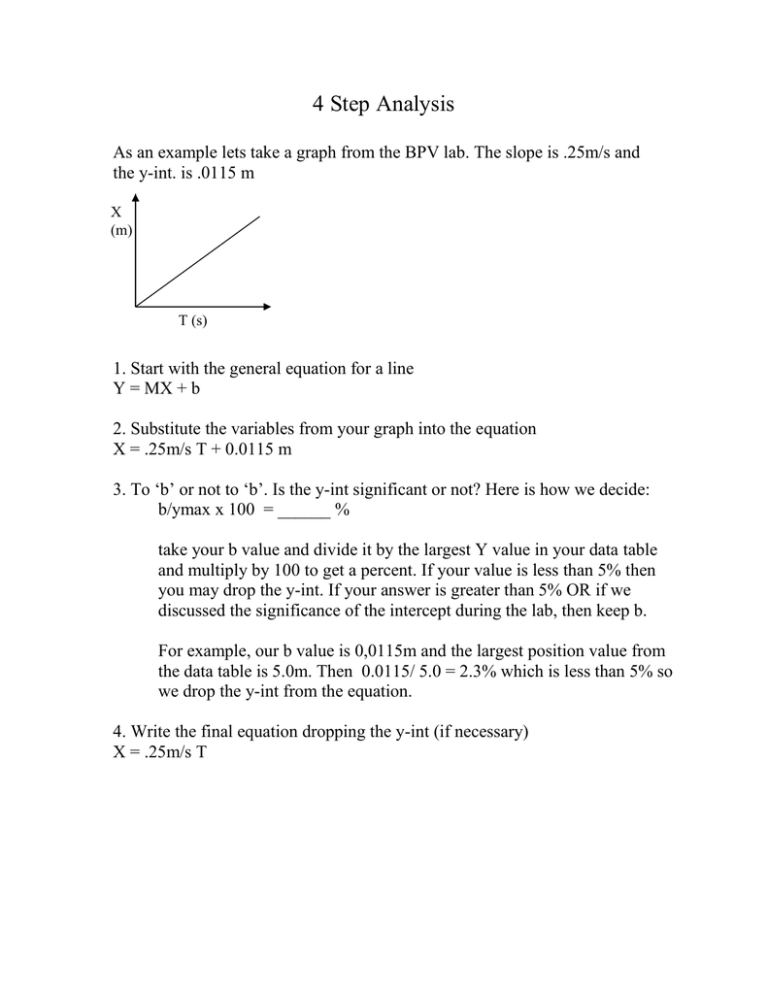
4 Step Analysis As an example lets take a graph from the BPV lab. The slope is .25m/s and the y-int. is .0115 m X (m) T (s) 1. Start with the general equation for a line Y = MX + b 2. Substitute the variables from your graph into the equation X = .25m/s T + 0.0115 m 3. To ‘b’ or not to ‘b’. Is the y-int significant or not? Here is how we decide: b/ymax x 100 = ______ % take your b value and divide it by the largest Y value in your data table and multiply by 100 to get a percent. If your value is less than 5% then you may drop the y-int. If your answer is greater than 5% OR if we discussed the significance of the intercept during the lab, then keep b. For example, our b value is 0,0115m and the largest position value from the data table is 5.0m. Then 0.0115/ 5.0 = 2.3% which is less than 5% so we drop the y-int from the equation. 4. Write the final equation dropping the y-int (if necessary) X = .25m/s T
