LOYOLA COLLEGE (AUTONOMOUS), CHENNAI – 600 034
advertisement
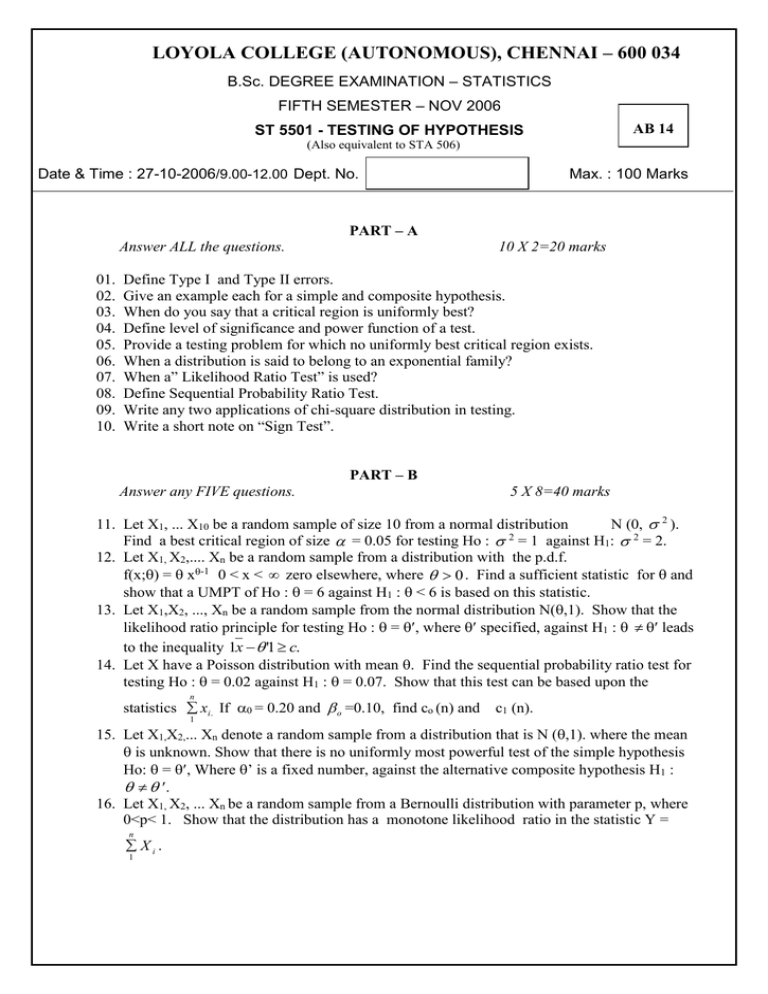
LOYOLA COLLEGE (AUTONOMOUS), CHENNAI – 600 034 B.Sc. DEGREE EXAMINATION – STATISTICS FIFTH SEMESTER – NOV 2006 AB 14 ST 5501 - TESTING OF HYPOTHESIS (Also equivalent to STA 506) Date & Time : 27-10-2006/9.00-12.00 Dept. No. Max. : 100 Marks PART – A Answer ALL the questions. 01. 02. 03. 04. 05. 06. 07. 08. 09. 10. 10 X 2=20 marks Define Type I and Type II errors. Give an example each for a simple and composite hypothesis. When do you say that a critical region is uniformly best? Define level of significance and power function of a test. Provide a testing problem for which no uniformly best critical region exists. When a distribution is said to belong to an exponential family? When a” Likelihood Ratio Test” is used? Define Sequential Probability Ratio Test. Write any two applications of chi-square distribution in testing. Write a short note on “Sign Test”. PART – B Answer any FIVE questions. 5 X 8=40 marks 11. Let X1, ... X10 be a random sample of size 10 from a normal distribution N (0, 2 ). Find a best critical region of size = 0.05 for testing Ho : 2 = 1 against H1: 2 = 2. 12. Let X1, X2,.... Xn be a random sample from a distribution with the p.d.f. f(x;) = x-1 0 < x < zero elsewhere, where 0 . Find a sufficient statistic for and show that a UMPT of Ho : = 6 against H1 : < 6 is based on this statistic. 13. Let X1,X2, ..., Xn be a random sample from the normal distribution N(,1). Show that the likelihood ratio principle for testing Ho : = , where specified, against H1 : leads to the inequality 1x '1 c. 14. Let X have a Poisson distribution with mean . Find the sequential probability ratio test for testing Ho : = 0.02 against H1 : = 0.07. Show that this test can be based upon the n statistics xi. If 0 = 0.20 and o =0.10, find co (n) and c1 (n). 1 15. Let X1,X2,... Xn denote a random sample from a distribution that is N (,1). where the mean is unknown. Show that there is no uniformly most powerful test of the simple hypothesis Ho: = , Where ’ is a fixed number, against the alternative composite hypothesis H1 : . 16. Let X1, X2, ... Xn be a random sample from a Bernoulli distribution with parameter p, where 0<p< 1. Show that the distribution has a monotone likelihood ratio in the statistic Y = n Xi. 1 17. The demand for a particular spare part in a factory was found to vary from day-to-day. In a sample study the following information was obtained. Day Mon Tue Wed Thu Fri Sat No of parts 1124 1125 1110 1120 1126 1115 demanded Using chi-square test, test the hypothesis that the number of parts demanded does not depend on the day of the week. Use 1% significance level. 18. The lengths in centimeters of n = 9 fish of a particular species captured off the New England coast were 32.5, 27.6, 29.3, 30.1, 15.5, 21.7, 22.8, 21.2, 19.0. Use Wilcoxon test to test Ho : m = 3.7 against the alternative hypothesis H1 : m > 3.7 at 5% significance level. PART – C Answer any TWO questions. 2 X 20 =40 marks 19. (a) State and prove Neyman –Pearson theorem. (b) Consider a distribution having a p.d.f. of the form f (x ; ) = x (1-)1-x, x = 0, 1 = 0, otherwise. 1 1 and H1: > . Use the central limit theorem to determine the sample size 20 20 n of a random sample so that a uniformly most powerful test of H0 against H1 has a power 1 1 function K(), with approximately K = 0.05 and K = 0.90. (10+10) 20 10 Let Ho : = 20. Let the independent random variables X and Y have distributions that are N(1,3) and N (2, 3) respectively, where the means 1, 2 and common variance 3 are unknown. If X 1, X2, ....,Xn and Y1, Y2, ... Ym are independent random samples from these distributions, derive a likelihood ratio test for testing H0 : 1=2 , unspecified and 3 unspecified against all alternatives. 21. (a) Let X be N (0,) and let ’ = 4, ” = 9. 0 = 0.05 and 0 =0.10. Show that n the sequential probability ratio test can be based on the statistic X 1 Determine c0 (n) and c1 (n). 2 i (b) A cigarette manufacturing firm claims that its brand A of the cigarettes outsells its brand B by 8%. If it is found that 42 out of a sample of 200 smokers prefer brand A and 18 out of another random sample of 100 smokers prefer brand B test whether the 8% difference is a valid claim. Use 5% level of significance. (10 + 10) 22. (a) Below is given the distribution of hair colours for either sex in a University. Hair colour Sex Fair Red Medium Dark Jet black Boys 592 119 849 504 36 Girls 544 97 677 451 14 Test the homogeneity of hair colour for either sex. Use 5% significance level. (b) Using run test, test for randomness for the following data : 15 77 01 65 69 58 40 81 16 16 20 00 84 22 28 26 46 66 36 86 66 17 43 49 85 40 51 40 10 . (10+10) _____________________
